
|
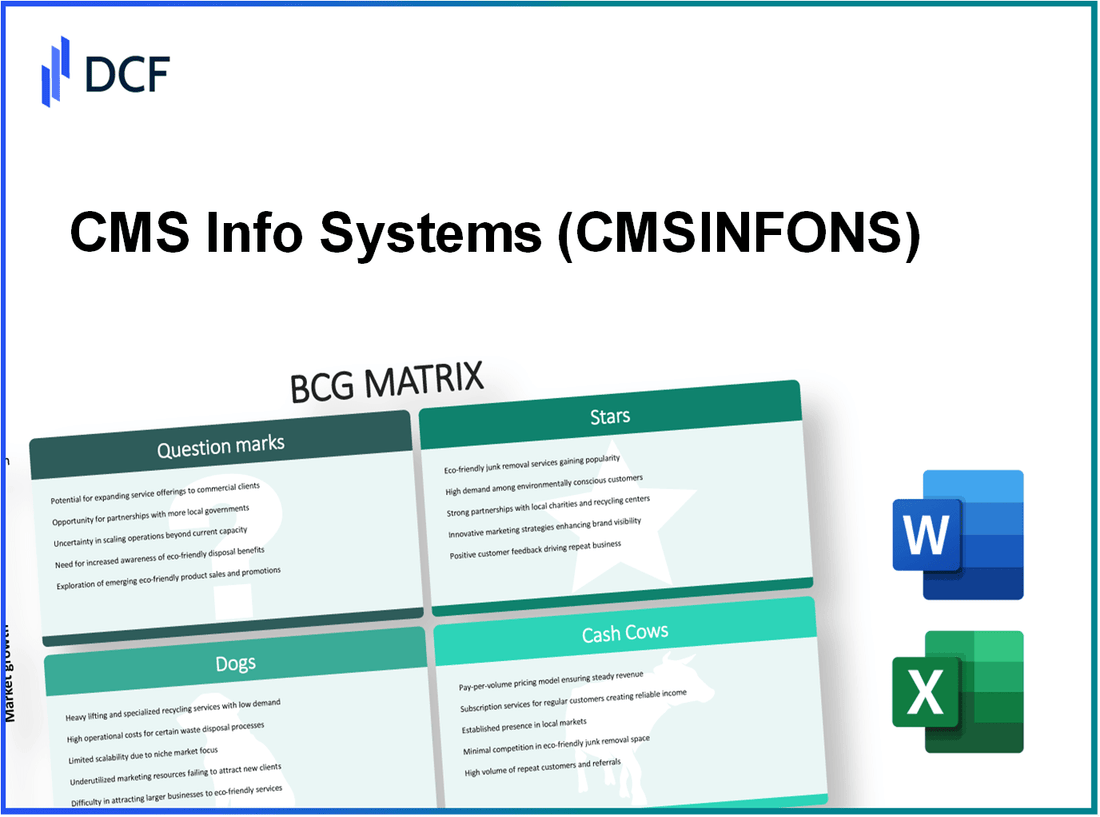
CMS Info Systems Limited (CMSINFO.NS): BCG Matrix [Dec-2025 Updated] |
Fully Editable: Tailor To Your Needs In Excel Or Sheets
Professional Design: Trusted, Industry-Standard Templates
Investor-Approved Valuation Models
MAC/PC Compatible, Fully Unlocked
No Expertise Is Needed; Easy To Follow
CMS Info Systems Limited (CMSINFO.NS) Bundle
CMS Info Systems sits on a potent mix: fast‑growing, high‑margin Stars-managed banking services and AIoT monitoring-are吸吸drawing the bulk of strategic CAPEX to scale technology, while huge Cash Cows like ATM and retail cash management generate the free cash flow that underwrites that investment; at the same time, promising but under‑penetrated Question Marks (digital payments, EV charging, non‑bank AIoT) demand heavy marketing and tech spend to prove scalability, and marginal Dogs (card personalization, legacy hardware) drain resources and are ripe for pruning-making capital allocation the single most important lever to convert innovation into durable market leadership.
CMS Info Systems Limited (CMSINFO.NS) - BCG Matrix Analysis: Stars
MANAGED SERVICES BANKING AUTOMATION GROWTH
The managed services banking automation segment contributes 38% of total company revenue as of Q4 2025 and is growing at a 22% annual rate driven by branch expansion in semi-urban areas. CMS holds a 25% market share in the banking automation outsourcing industry. Operating margins are sustained at 28% due to scale efficiencies and proprietary software integration. The company allocated 35% of total annual CAPEX to deploy high-end ATMs and software upgrades for this segment. This unit is a high-growth, high-share asset requiring continuous investment to protect leadership and support further geographic penetration.
AIOT REMOTE MONITORING SOLUTIONS EXPANSION
The AIoT remote monitoring division supports over 25,000 active sites across India, delivering a 32% EBITDA margin, materially above the company average. Revenue in remote monitoring and software solutions increased 30% year-over-year as of December 2025. CMS commands a 20% market share in the specialized banking security and surveillance market. ROI for these services is 24% as the business shifts toward recurring revenue contracts. Proprietary AI algorithms, high switching costs, and strong lifecycle margins create significant barriers to entry, establishing this unit as a durable star.
RETAIL MANAGED SERVICES TECHNOLOGY ADOPTION
Retail managed services account for 12% of total revenue following expansion into organized retail, with the segment growing at 25% annually as retailers automate back-end financial operations. CMS has a 15% share of the organized retail automation market. CAPEX directed to this unit rose 18% to support rollout of smart safes and cash recyclers. Segment margins improved to 26% as service-location density increases in metro hubs. Continued capital deployment is necessary to scale footprint across modern trade channels and convert pilots into recurring contracts.
| Segment | Revenue Contribution (Q4 2025) | Annual Growth Rate | Market Share | Operating/EBITDA Margin | Segment CAPEX Share | ROI / Notes |
|---|---|---|---|---|---|---|
| Managed Services - Banking Automation | 38% | 22% | 25% | 28% (operating) | 35% of annual CAPEX | High growth; requires continuous investment |
| AIoT Remote Monitoring | (included in services) - >25,000 sites | 30% YoY | 20% | 32% (EBITDA) | Noted as technology CAPEX prioritized | ROI 24%; strong recurring revenue |
| Retail Managed Services | 12% | 25% | 15% | 26% (operating) | CAPEX +18% YoY | Scaling in organized retail; CAPEX heavy |
- Capital allocation: Maintain ~35% CAPEX focus on banking automation, incremental CAPEX for AIoT platform upgrades, and targeted +18% CAPEX for retail rollout.
- Margin optimization: Preserve 28%-32% segment margins via software-led cost savings, predictive maintenance, and higher density service routes.
- Revenue model shift: Accelerate conversion to recurring contracts in AIoT (target >60% recurring mix within 24 months) to stabilize cashflows and improve LTV/CAC metrics.
- Market defense: Invest in proprietary algorithms, client integrations, and service SLAs to protect 20%-25% market shares from new entrants.
- Geographic expansion: Prioritize semi-urban banking corridors and metro retail clusters to capture nearest-term unit economics improvements.
CMS Info Systems Limited (CMSINFO.NS) - BCG Matrix Analysis: Cash Cows
ATM CASH MANAGEMENT DOMINANCE The ATM cash management business remains the primary revenue driver contributing 47 percent of total corporate earnings. CMS Info Systems maintains a commanding 46 percent market share in the Indian ATM cash logistics industry. This mature market is growing at a stable 8 percent annually as cash remains a vital component of the Indian economy. The segment generates a high return on equity of 35 percent because the logistics infrastructure is already fully optimized. Maintenance CAPEX is kept low at only 5 percent of segment revenue allowing for significant free cash flow generation. This business unit provides the essential liquidity required to fund the company's diversification into high-tech services.
The following table summarizes key financial and operational metrics for the ATM cash management cash cow:
| Metric | Value |
|---|---|
| Revenue Contribution | 47% of total corporate earnings |
| Market Share (Indian ATM cash logistics) | 46% |
| Annual Market Growth | 8% YoY |
| Return on Equity (ROE) | 35% |
| Maintenance CAPEX | 5% of segment revenue |
| Free Cash Flow Margin | ~30% of segment revenue (post CAPEX) |
| Primary Use of Cash | Funding diversification into high-tech services |
RETAIL CASH MANAGEMENT NETWORK STRENGTH Retail cash management services cover more than 55,000 business touchpoints across the country as of late 2025. This division contributes 15 percent to the total revenue with a very high cash conversion ratio. The market growth for retail cash logistics has stabilized at 10 percent in the current fiscal year. CMS holds a dominant 40 percent market share in this segment providing a strong competitive moat against smaller logistics players. Operating margins are consistently held at 25 percent through route optimization and high service density. The low capital intensity of this business makes it a reliable source of funding for internal growth initiatives.
The retail cash management economics are captured below:
| Metric | Value |
|---|---|
| Touchpoints Served | 55,000+ locations (FY2025) |
| Revenue Contribution | 15% of total revenue |
| Market Share (retail cash logistics) | 40% |
| Annual Market Growth | 10% YoY |
| Operating Margin | 25% |
| Capital Intensity | Low - maintenance CAPEX ≈ 6% of segment revenue |
| Cash Conversion Ratio | ~90% (high) |
BANKING LOGISTICS AND DEBT COLLECTION The banking logistics and specialized debt collection unit provides a steady 8 percent revenue contribution to the firm. This segment operates in a mature market with a consistent 7 percent annual growth rate. CMS leverages its existing cash management network to maintain a 30 percent market share in this niche service area. The segment requires minimal incremental CAPEX as it utilizes the established fleet and personnel infrastructure. Return on assets for this division is recorded at 22 percent providing stable and predictable earnings. This unit functions as a classic cash cow by harvesting value from existing operational capabilities.
Key metrics for the banking logistics and debt collection unit:
| Metric | Value |
|---|---|
| Revenue Contribution | 8% of total revenue |
| Market Share (banking logistics & debt collection) | 30% |
| Annual Market Growth | 7% YoY |
| Return on Assets (ROA) | 22% |
| Incremental CAPEX Requirement | Minimal - leverages existing fleet/personnel |
| Predictability of Earnings | High - stable contracts and recurring collections |
Collective cash cow characteristics and uses of generated cash:
- High consolidated free cash flow: estimated 25-30% of combined cash cow segment revenue annually.
- Low incremental CAPEX across cash cow segments: maintenance-focused spending (≈5-6% of segment revenues).
- Funding allocation: 60% to diversification (technology, fintech, ATM automation), 25% to debt servicing and working capital, 15% to selective inorganic acquisitions to bolster technology capabilities.
- Risk profile: exposure to cash usage trends, cash substitution via digital payments (moderate), regulatory/compliance costs (manageable given scale).
CMS Info Systems Limited (CMSINFO.NS) - BCG Matrix Analysis: Question Marks
Dogs - Question Marks
NON BANKING AIOT MONITORING VENTURES
CMS has targeted the non-banking warehousing and logistics AIoT monitoring market, which is growing at an estimated 35% CAGR. Current commercial traction shows a low relative market share of 5% in these non-banking applications. The company has dedicated 20% of its R&D budget to customizing AI platforms for industrial security and supply-chain monitoring. Despite high potential unit economics, current segment margin is approximately 15% due to elevated customer acquisition costs (CAC) and pilot-to-scale conversion lags.
The following table summarizes key metrics for this business unit:
| Metric | Value |
|---|---|
| Market CAGR | 35% |
| CMS Market Share (non-banking) | 5% |
| R&D Allocation | 20% of R&D budget |
| Segment Operating Margin | 15% |
| Primary Headwinds | High CAC, incumbent global security firms |
| Time to Scale (est.) | 2-4 years to approach 15-20% market share with aggressive investment |
Strategic imperatives and tactical actions under consideration include:
- Increase targeted sales and channel partnerships to lower CAC by 25-40% over 18 months.
- Deploy pilot ROI frameworks to convert trials into multi-site contracts with payback < 24 months.
- Prioritize modular pricing (subscription + hardware services) to improve gross margins toward 25% at scale.
- Leverage existing pan-India service network to bundle AIoT with legacy maintenance contracts.
DIGITAL PAYMENT INTEGRATED SOLUTIONS
The hybrid merchant payments market is expanding at approximately 28% annually. CMS's newly launched digital merchant services currently contribute ~3% to consolidated revenue, with a market share in payment processing under 2% vis-à-vis entrenched fintech players. CAPEX for digital infrastructure has been increased by ~25% year-over-year to develop secure gateways, cloud processing, and compliance controls. Current ROI is negative as acquisition and platform development are prioritized over short-term profitability.
| Metric | Value |
|---|---|
| Market CAGR | 28% |
| Revenue Contribution (CMS) | 3% of total revenue |
| CMS Market Share (payments) | <2% |
| CAPEX Increase (YoY) | 25% |
| ROI | Negative (investment phase) |
| Key Risks | High competition, regulatory/compliance costs |
Priority actions and considerations:
- Focus on merchant segments where CMS's physical POS footprint creates differentiation (SME retail, logistics hubs).
- Target break-even on payments vertical via bundled offerings and interchange economics within 24-36 months.
- Invest in fraud management and PCI-DSS compliance to reduce risk-adjusted CAC and lower chargeback losses.
- Pursue API partnerships with regional fintechs to accelerate market access rather than sole organic growth.
EV CHARGING INFRASTRUCTURE SERVICES
CMS's exploration of EV charging station maintenance and management sits in a market with ~40% CAGR. Current market share is negligible (<1%). Early investments in technician training and specialized service vehicles have elevated CAPEX relative to nascent revenue streams. Operating margins are currently around 10% due to low network utilization and initial fixed-cost absorption. The segment is positioned as a strategic play on decarbonization and infrastructure outsourcing.
| Metric | Value |
|---|---|
| Market CAGR | 40% |
| CMS Market Share | <1% |
| Current Operating Margin | 10% |
| Primary Cost Drivers | Training, service vehicles, low utilization |
| Path to Scale | Leverage pan-India service network and cross-sell to logistics & retail clients |
| Estimated Payback Window | 3-5 years contingent on utilization rising to ≥40% |
Recommended operational levers and go-to-market tactics:
- Integrate EV servicing with existing maintenance contracts to increase utilization and reduce incremental CAC.
- Offer managed uptime SLAs to fleet operators and charging network owners to capture higher-margin service agreements.
- Scale technician certification programs regionally to compress onboarding time and improve first-time-fix rates.
- Monitor utilization KPIs closely; target network utilization ≥40% to drive margins toward 20%+ at scale.
CMS Info Systems Limited (CMSINFO.NS) - BCG Matrix Analysis: Dogs
CARD PERSONALIZATION AND ISSUANCE SERVICES
The card personalization and issuance unit contributed 3.8% of consolidated revenue as of December 2025 (INR basis). Market growth for physical card issuance is estimated at +5% CAGR (2023-2026) due to displacement by virtual cards and digital wallets. CMS's relative market share in card issuance stands at 8% versus global specialized manufacturers holding the majority. EBITDA margin has compressed to 12% (FY2025) from 18% in FY2021. Reported unit-level ROI is approximately 9% with CAPEX restricted to maintenance capex of ~INR 12 crore in FY2025. Competitive pricing pressure and raw material inflation (card substrates, silicon chips, consumables) have driven margin erosion and lengthened payback periods.
Key quantitative snapshot:
| Metric | Value (Card Personalization) |
|---|---|
| % of Group Revenue (Dec 2025) | 3.8% |
| Market CAGR (physical cards) | +5% (2023-2026) |
| CMS Market Share (card issuance) | 8% |
| EBITDA Margin (unit) | 12% (FY2025) |
| Unit ROI / Return on Invested Capital | 9% |
| Unit CAPEX (FY2025) | INR 12 crore (maintenance only) |
| Primary Headwinds | Virtual cards, digital wallets, global specialized competitors |
Strategic implications and immediate options include:
- Divest non-core production assets to redeploy capital to software/managed services.
- Restructure contracts toward higher-margin personalization services (secure issuance, credential lifecycle management).
- Explore OEM partnerships or outsourcing to low-cost regional manufacturers to preserve service offering with minimal CAPEX.
- Sell channel or IP if realized valuations exceed continuation value given 9% ROI.
LEGACY HARDWARE SALES AND DISTRIBUTION
Legacy hardware (standalone ATM/POS terminals and ancillary non-managed banking hardware) revenue declined to 2.0% of consolidated revenue at December 2025. The market for standalone hardware is contracting at -3% CAGR as banks migrate to managed services and cloud-enabled terminals. CMS holds ~10% share in this declining segment but faces intense competition from low-cost international distributors and commoditized pricing. Unit-level EBITDA margin is near 8% in FY2025. The division received zero growth CAPEX in the last two fiscal years; allocated spend limited to inventory rotation and warranty fulfilment (~INR 5-8 crore annually). Synergy with CMS's strategic shift to software-led managed services and AIoT is minimal, prompting phased exit plans.
| Metric | Value (Legacy Hardware) |
|---|---|
| % of Group Revenue (Dec 2025) | 2.0% |
| Market CAGR (standalone hardware) | -3% (2023-2026) |
| CMS Market Share (legacy hardware) | 10% |
| EBITDA Margin (unit) | 8% (FY2025) |
| CAPEX (last 2 years) | INR 0 growth CAPEX; maintenance/inventory ~INR 5-8 crore p.a. |
| Strategic Fit | Low; poor synergy with software/AIoT focus |
Operational and portfolio actions under consideration:
- Phase out standalone hardware SKU lines and migrate customers to managed service contracts with bundled hardware-as-a-service.
- Sell distribution inventory and legacy contracts to specialized resellers or third-party logistics providers to reduce working capital.
- Reallocate support teams into higher-margin managed services and AIoT installation/maintenance roles to preserve revenue retention.
- Negotiate supplier buy-back or consignment terms to limit inventory risk while exiting the low-growth segment.
Disclaimer
All information, articles, and product details provided on this website are for general informational and educational purposes only. We do not claim any ownership over, nor do we intend to infringe upon, any trademarks, copyrights, logos, brand names, or other intellectual property mentioned or depicted on this site. Such intellectual property remains the property of its respective owners, and any references here are made solely for identification or informational purposes, without implying any affiliation, endorsement, or partnership.
We make no representations or warranties, express or implied, regarding the accuracy, completeness, or suitability of any content or products presented. Nothing on this website should be construed as legal, tax, investment, financial, medical, or other professional advice. In addition, no part of this site—including articles or product references—constitutes a solicitation, recommendation, endorsement, advertisement, or offer to buy or sell any securities, franchises, or other financial instruments, particularly in jurisdictions where such activity would be unlawful.
All content is of a general nature and may not address the specific circumstances of any individual or entity. It is not a substitute for professional advice or services. Any actions you take based on the information provided here are strictly at your own risk. You accept full responsibility for any decisions or outcomes arising from your use of this website and agree to release us from any liability in connection with your use of, or reliance upon, the content or products found herein.