
|
Concentrix Corporation (CNXC): BCG Matrix [Dec-2025 Updated] |
Fully Editable: Tailor To Your Needs In Excel Or Sheets
Professional Design: Trusted, Industry-Standard Templates
Investor-Approved Valuation Models
MAC/PC Compatible, Fully Unlocked
No Expertise Is Needed; Easy To Follow
Concentrix Corporation (CNXC) Bundle
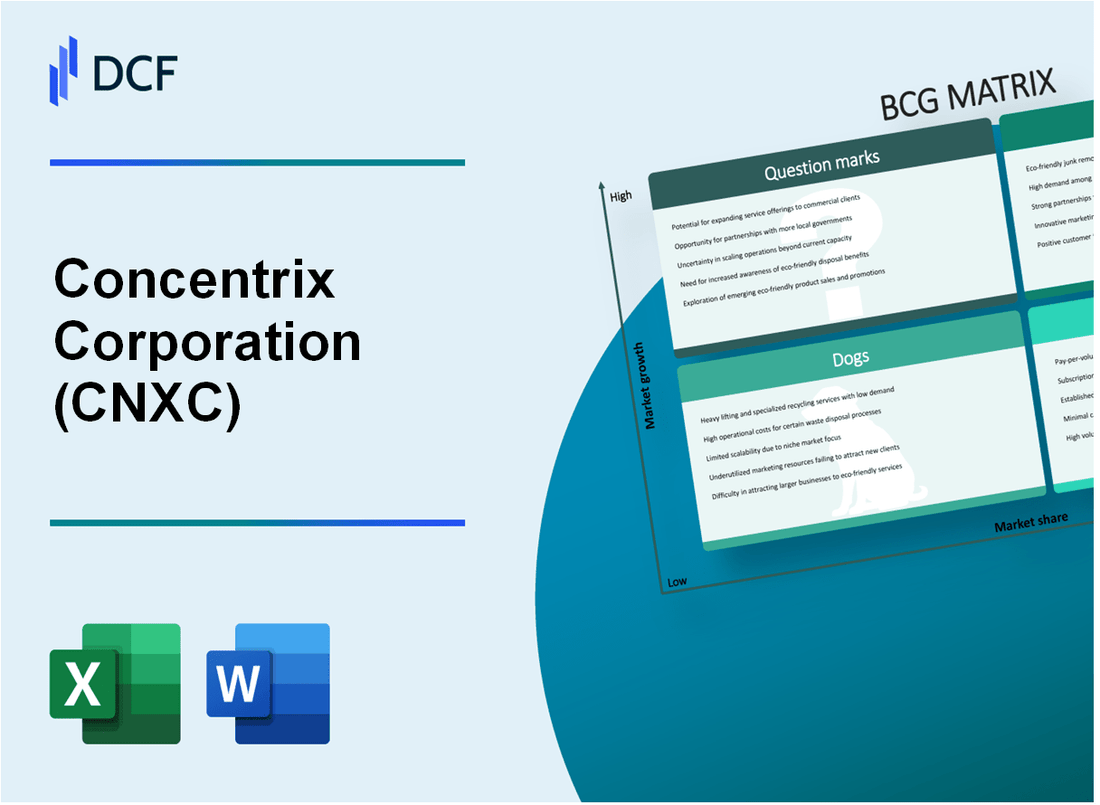
You're looking at Concentrix Corporation's portfolio right after the massive Webhelp integration, and frankly, the BCG Matrix tells a clear story about where the money is and where the risk lies. While the broader CX BPO market is expanding at a solid 11.6% CAGR, and the combined entity projects revenue near $9.823 billion, the overall constant currency growth is only creeping along between 1.75% to 2.0%, all while carrying about $5.2 billion in debt from that big deal. We need to see which parts are the Stars pulling the future forward and which are the Dogs dragging down margins. Dive in below to see the breakdown of your Stars, Cash Cows, Dogs, and Question Marks.
Background of Concentrix Corporation (CNXC)
Concentrix Corporation is a global technology and services leader that designs and delivers customer experience (CX) solutions to help global brands manage their customer interactions across digital channels and contact centers. As of late 2025, Concentrix Corporation has a team of approximately 450,000 employees operating across 75 countries. The company was founded in 1995 as a division of SYNNEX Corporation, eventually emerging as a standalone entity in 2014. A major strategic move was the acquisition of Webhelp in 2023 for $3.8 billion, which significantly expanded Concentrix Corporation's global footprint. The company currently holds an estimated market share of 2.72% in the customer-experience-management market, ranking it #9 in that category.
Looking at the most recent reported period, for the third quarter of fiscal 2025, which ended on August 31, 2025, Concentrix Corporation reported revenue of $2,483.25 million. This represented a 4.0% increase year-on-year on an as reported basis, or a 2.6% growth on a constant currency basis, exceeding the company's guidance for the quarter. Net income for the third quarter was $88.11 million, a substantial increase from $16.63 million in the prior year's third quarter. Diluted earnings per share from continuing operations for Q3 2025 reached $1.34.
Concentrix Corporation's business is segmented across several key industries, with Q3 2025 revenue figures showing the relative size of these operations. The Technology and Consumer Electronics segment generated $670.6 million, showing a 1% year-on-year increase. The Retail, Travel, and E-commerce segment brought in $622.8 million, marking a 5% increase. The Communications and Media segment grew by 8% to generate $411.2 million, and the Banking, Financial Services, and Insurance segment saw a strong 9% increase, reporting revenue of $384.4 million.
Management has provided an updated outlook for the full fiscal year 2025, projecting total reported revenue between $9.798 billion and $9.823 billion. This implies a constant currency revenue growth expectation for the full year in the range of 1.75% to 2.0%. Furthermore, Concentrix Corporation continues to focus on shareholder returns, having increased its quarterly dividend to $0.36 per share, payable in November 2025, and repurchasing approximately 800,000 common shares for a cost of $42.2 million during the third quarter.
Concentrix Corporation (CNXC) - BCG Matrix: Stars
Stars in the Boston Consulting Group Matrix represent business units or offerings within Concentrix Corporation (CNXC) that operate in high-growth markets and command a high relative market share. These units are leaders but require significant investment to maintain their growth trajectory and market position, often resulting in cash flow neutrality.
The current portfolio positioning suggests several areas are operating as Stars, driven by significant investment in digital transformation and artificial intelligence capabilities. These areas are characterized by strong top-line momentum, even as the company manages near-term profitability pressures.
The focus on AI-integrated solutions is a primary driver for Star status. The company's proprietary technology platforms are seeing high adoption rates, which translates directly into client value and stickiness. For instance, the deployment of iX AI platforms has been shown to drive efficiency gains ranging from 20% to 40% across specific operations like healthcare, retail, and supply chain. This level of demonstrable operational improvement positions these integrated offerings as market leaders.
The vertical segments showing the strongest growth are indicative of high-market-share positions within expanding sectors. You can see the Q3 2025 year-over-year revenue performance below:
| Vertical Segment | Q3 2025 Year-over-Year Revenue Growth |
| Banking, Financial Services, and Insurance (BFSI) | 9% |
| Communications and Media | 8% |
The 9% revenue growth in the Banking, Financial Services, and Insurance (BFSI) vertical for Q3 2025 was noted as leading the company's growth for the quarter. Similarly, the Communications and Media vertical's 8% growth in Q3 2025 was well above the reported total company reported revenue increase of 4% year-on-year for the quarter.
The iX Product Suite, which includes the Intelligent Experience (iX) technology platform, is central to maintaining this Star positioning. Specific features within this suite, such as iX Hero, are delivering measurable performance uplifts for clients, which reinforces client stickiness and market leadership. Key performance indicators achieved in production studies include:
- Measurable improvements in Customer Satisfaction (CSAT) by up to 9%.
- First Contact Resolution (FCR) improved by as much as 11%.
- Speed to Proficiency accelerated by up to 15%.
- Communication Scores boosted by 33.6% with features like Harmony and Clarity.
- Net Promoter Scores (NPS) improved by 22.3%.
The overall company reported total revenue for Q3 2025 was $2.48 billion, a 4.0% increase year-on-year as reported. The continued investment in these high-growth areas, like the iX suite, is a key tenet of the strategy to convert these Stars into future Cash Cows when market growth normalizes. For instance, the company generated $178.8 million in adjusted free cash flow for the quarter, which is being reinvested alongside other capital allocation activities, such as the declared quarterly dividend of $0.36 per share payable on November 4, 2025.
Concentrix Corporation (CNXC) - BCG Matrix: Cash Cows
The massive scale of the combined entity projects full-year 2025 revenue up to $9.823 billion.
The Technology and Consumer Electronics vertical, the largest segment by Q3 2025 revenue, recorded $670.6 million, but only grew at 1% year-on-year.
Core, large-scale, traditional BPO operations provide stable, high-volume cash flow, despite the overall company constant currency growth guidance for the full year being between 1.75% and 2.0%. This segment underpins the expected full-year 2025 Adjusted Free Cash Flow generation, guided to be between $585 million and $610 million.
- Full Year 2025 Reported Revenue Guidance Range: $9.798 billion to $9.823 billion.
- Q3 2025 Total Reported Revenue: $2,483.3 million.
- Planned Shareholder Returns for Fiscal 2025: Approximately $240 million via repurchases and dividends.
- Quarterly Dividend authorized: Increased to $0.36 per share.
Global market position is significant, holding a substantial share alongside Teleperformance and Accenture in the mature Business Process Outsourcing (BPO) space. As of 2024 data, these three players collectively controlled nearly 26% of the global BPO services market revenue.
| Market Leader | Approximate Global BPO Market Share (2024) |
| Accenture | 10.24% |
| Teleperformance | 8.67% |
| Concentrix Corporation | Implied Share within the 26% collective control |
Concentrix Corporation (CNXC) - BCG Matrix: Dogs
You're looking at the units within Concentrix Corporation (CNXC) that are stuck in low-growth markets and hold a low relative market share. These are the classic Dogs-they tie up capital without delivering significant returns, making them prime candidates for divestiture or aggressive cost-cutting.
The core issue here is the market's rapid pivot away from the legacy service model that once underpinned a significant portion of Concentrix Corporation's operations. While the broader CX outsourcing market sees non-voice channels-chat, email, and social media-dominating at $\mathbf{65\%}$ of CX revenue as of 2025, the Dog segment is characterized by its lagging adoption of these digital channels. These legacy, non-digital, voice-only contracts are in a shrinking market space, defintely acting as a drag on overall growth metrics.
Here are the concrete characteristics defining these Dog business units for Concentrix Corporation:
- Legacy, non-digital, voice-only contracts, as the market shifts to non-voice channels dominating $\mathbf{65\%}$ of CX revenue.
- Underperforming or excess capacity in certain geographies, which impacted operating margins in 2025.
- Highly commoditized, low-margin transactional services that face intense price competition from smaller, regional players.
- Certain mature, slower-growth client relationships that require high maintenance capital expenditure (CapEx) but yield minimal revenue expansion.
The financial evidence points directly to margin pressure, which is a hallmark of a Dog unit struggling to cover its costs. The company's overall reported operating margin for Q3 2025 was $\mathbf{5.9\%}$, and the S&P Global Ratings-adjusted EBITDA margin estimate for the full fiscal year 2025 sits at $\mathbf{17.5\%}$, which is flat compared to the prior year and reflects these headwinds. Furthermore, the overall Net Margin for Concentrix Corporation was reported at $\mathbf{2.82\%}$, indicating that profitability is thin across the board, with Dogs consuming cash flow that could otherwise fuel Stars or Question Marks.
The pressure is compounded by strategic missteps or external shocks. For instance, margin headwinds in 2025 were explicitly attributed to operational inefficiencies tied to specific clients impacted by tariffs, alongside investments to increase capacity for expected volumes that were subsequently delayed. This highlights the risk of high maintenance CapEx in mature relationships that don't materialize into revenue growth.
Here's a quick look at how the margin profile suggests the weight of these lower-value services, considering the higher-margin Catalyst business is less than $\mathbf{10\%}$ of total revenue:
| Metric | Value (FY 2025 Estimate/Q3 2025 Actual) | Context |
| Reported Operating Margin (Q3 2025) | 5.9% | Reflects pressure from legacy/low-margin work. |
| Adjusted EBITDA Margin (FY 2025 Estimate) | 17.5% | Includes benefits from offshoring and AI, but still constrained. |
| Overall Net Margin (Latest Reported) | 2.82% | Indicates minimal profit retention across the portfolio. |
| Unadjusted Free Operating Cash Flow (FY 2025 Expectation) | About $560 million | Cash is generated, but Dogs prevent it from being higher. |
The market itself is signaling the need to avoid these areas. The general industry trend shows that customer service roles susceptible to automation are projected to decline by $\mathbf{8\%}$ by 2026, directly threatening the transactional services that fall into this quadrant. Concentrix Corporation's overall constant currency revenue growth guidance for the full year 2025 is only $\mathbf{1\%}$ to $\mathbf{2\%}$, which suggests that the high-growth segments are being offset by the slow or negative growth in these mature, low-share areas. You need to look closely at which specific contracts or geographies are driving the need to hold excess capacity, as that is where the cash trap is most evident.
Finance: draft a zero-based budget review for all contracts signed before 2022 by Friday.
Concentrix Corporation (CNXC) - BCG Matrix: Question Marks
You're looking at the areas of Concentrix Corporation that are in fast-growing markets but haven't yet secured a dominant position. These units consume cash now, hoping to become tomorrow's Stars. They require significant capital to push market share higher before they risk becoming Dogs.
The geographic expansion into Europe, Latin America, and Africa following the Webhelp acquisition is a prime example of a Question Mark. This expansion requires heavy investment for integration and capturing market share in these new, large territories. Post-acquisition, approximately 88% of Concentrix Corporation's revenue was generated from non-U.S. operations, with substantial contributions from these newly bolstered regions. Still, the geographic delivery of revenue is often reported as being split roughly 1/3 Americas, 1/3 EMEA, 1/3 Asia, indicating the scale of the integration challenge across these distinct markets.
This push for scale is tied directly to the substantial debt load incurred for the Webhelp deal. The outline suggests a figure of approximately $5.2 billion related to the financing. To service this, high growth is necessary to justify the interest expense. For fiscal year 2025, S&P Global Ratings expected Concentrix Corporation to sustain leverage modestly above 3x, specifically forecasting an adjusted leverage of about 3.1x in 2025. This leverage level demands successful integration and rapid market share capture to improve cash flow metrics, such as the expected unadjusted Free Operating Cash Flow (FOCF) of about $560 million for 2025.
New digital CX channels and non-voice services represent other Question Marks. These are high-growth areas where Concentrix Corporation is investing upfront to establish a leading share. The company is actively lessening its exposure to lower complexity transactions while growing its higher complexity integrated solutions. This strategic pivot requires significant capital expenditure to build out the necessary technology and expertise to compete effectively against established digital pure-plays.
Investments in new Generative AI (GenAI) capabilities, such as the iX Hello™ platform, are high-cost R&D bets with uncertain near-term Return on Investment (ROI). The company is definitely on the front foot with GenAI, using it to secure strategic tech-enabled CX programs. However, these investments come with immediate costs; for instance, Q3 2025 saw an $8 million impact from additional investments in cybersecurity specifically for Generative AI. The potential payoff is significant, as iX AI platforms are reported to drive efficiency gains in the range of 20-40% in certain operations.
Here is a snapshot of Concentrix Corporation's recent financial context to frame these growth investments:
| Metric | Value/Range | Period/Context |
|---|---|---|
| Total Revenue | $9,618.9 million | Fiscal Year 2024 (FY2024) |
| Q3 2025 Revenue | $2.525 to $2.550 billion | Q4 2025 Guidance Implied |
| FY 2025 Projected Constant Currency Revenue Growth | 1.75% to 2% | Fiscal Year 2025 Guidance |
| FY 2025 Projected Non-GAAP Operating Income | $1.25 billion to $1.26 billion | Fiscal Year 2025 Guidance |
| GenAI Investment Impact | $8 million | Q3 2025 Additional Cybersecurity Spend for GenAI |
| Expected 2025 Leverage (Adjusted) | About 3.1x | S&P Global Ratings Forecast for 2025 |
The strategy here is clear: you must invest heavily in these areas to rapidly increase market share, or they will quickly become Dogs. Finance: draft the 13-week cash view incorporating the Q4 2025 guidance by Friday.
Disclaimer
All information, articles, and product details provided on this website are for general informational and educational purposes only. We do not claim any ownership over, nor do we intend to infringe upon, any trademarks, copyrights, logos, brand names, or other intellectual property mentioned or depicted on this site. Such intellectual property remains the property of its respective owners, and any references here are made solely for identification or informational purposes, without implying any affiliation, endorsement, or partnership.
We make no representations or warranties, express or implied, regarding the accuracy, completeness, or suitability of any content or products presented. Nothing on this website should be construed as legal, tax, investment, financial, medical, or other professional advice. In addition, no part of this site—including articles or product references—constitutes a solicitation, recommendation, endorsement, advertisement, or offer to buy or sell any securities, franchises, or other financial instruments, particularly in jurisdictions where such activity would be unlawful.
All content is of a general nature and may not address the specific circumstances of any individual or entity. It is not a substitute for professional advice or services. Any actions you take based on the information provided here are strictly at your own risk. You accept full responsibility for any decisions or outcomes arising from your use of this website and agree to release us from any liability in connection with your use of, or reliance upon, the content or products found herein.