
|
Capital One Financial Corporation (COF) DCF Valuation |
Fully Editable: Tailor To Your Needs In Excel Or Sheets
Professional Design: Trusted, Industry-Standard Templates
Investor-Approved Valuation Models
MAC/PC Compatible, Fully Unlocked
No Expertise Is Needed; Easy To Follow
Capital One Financial Corporation (COF) Bundle
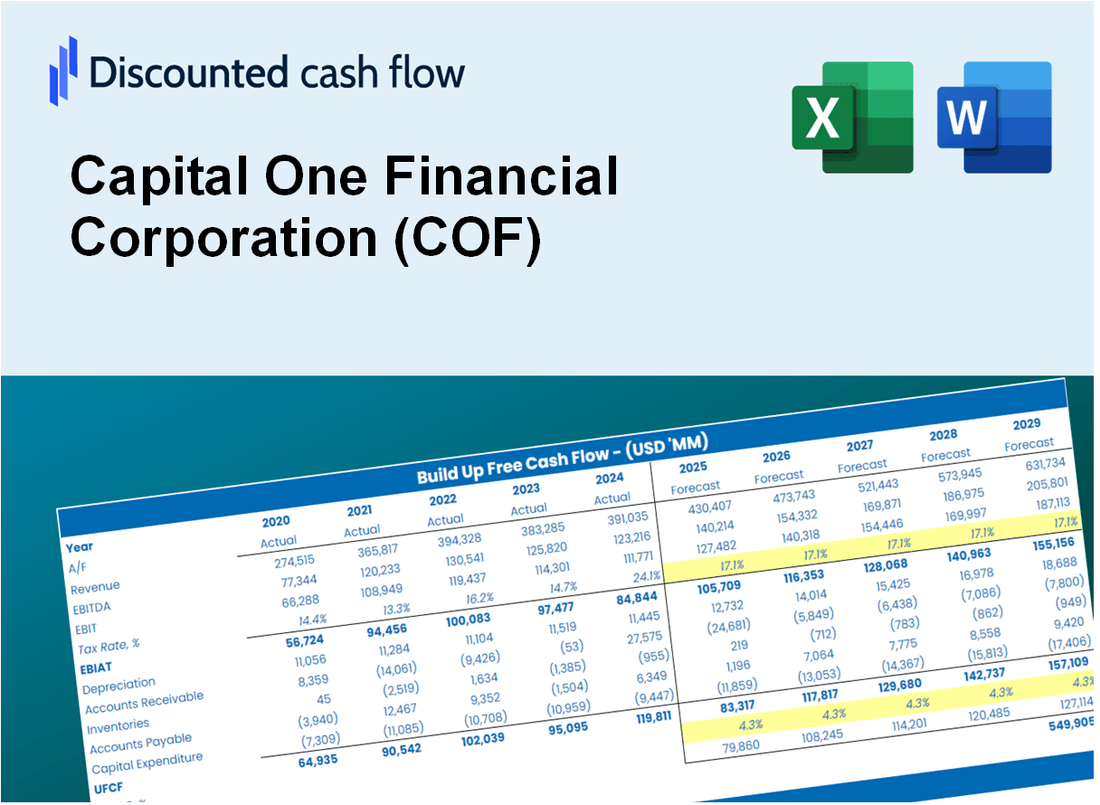
Discover the true potential of Capital One Financial Corporation (COF) with our advanced DCF Calculator! Adjust essential assumptions, explore various scenarios, and evaluate how different changes affect Capital One Financial Corporation (COF) valuation – all within a comprehensive Excel template.
What You Will Receive
- Adjustable Forecast Parameters: Seamlessly modify assumptions (growth %, margins, WACC) to explore various scenarios.
- Comprehensive Financial Data: Capital One Financial Corporation's (COF) financial information pre-loaded to facilitate your analysis.
- Instant DCF Calculations: The model automatically computes Net Present Value (NPV) and intrinsic value for your convenience.
- Tailored and Professional Design: A refined Excel model that can be customized to meet your valuation requirements.
- Designed for Analysts and Investors: Perfect for evaluating projections, confirming strategies, and enhancing efficiency.
Key Features
- Comprehensive Financial Data: Gain access to precise pre-loaded historical figures and future forecasts for Capital One Financial Corporation (COF).
- Adjustable Forecast Inputs: Modify highlighted cells for key metrics such as WACC, growth rates, and profit margins.
- Real-Time Calculations: Instant updates to DCF, Net Present Value (NPV), and cash flow evaluations.
- User-Friendly Dashboard: Clear charts and summaries to help visualize your valuation insights.
- Designed for All Skill Levels: An intuitive layout tailored for investors, CFOs, and consultants alike.
How It Works
- Download the Template: Get instant access to the Excel-based COF DCF Calculator.
- Input Your Assumptions: Adjust yellow-highlighted cells for growth rates, WACC, margins, and more.
- Instant Calculations: The model automatically updates Capital One’s intrinsic value.
- Test Scenarios: Simulate different assumptions to evaluate potential valuation changes.
- Analyze and Decide: Use the results to guide your investment or financial analysis.
Why Choose This Calculator for Capital One Financial Corporation (COF)?
- Precision: Utilizes accurate Capital One financial data for reliable results.
- Adaptability: Built for users to easily adjust and experiment with inputs.
- Efficiency: Avoid the complexity of constructing a DCF model from the ground up.
- Expert-Level: Crafted with the expertise and functionality expected by financial executives.
- Intuitive: Simple to navigate, making it accessible for users of all financial backgrounds.
Who Should Use This Product?
- Investors: Accurately estimate Capital One’s fair value before making investment decisions.
- CFOs: Leverage a professional-grade DCF model for financial reporting and analysis.
- Consultants: Quickly adapt the template for valuation reports for clients.
- Entrepreneurs: Gain insights into financial modeling used by leading financial institutions.
- Educators: Use it as a teaching tool to demonstrate valuation methodologies.
What the Template Contains
- Comprehensive DCF Model: Editable template featuring detailed valuation calculations tailored for Capital One Financial Corporation (COF).
- Real-World Data: Capital One's historical and projected financials preloaded for thorough analysis.
- Customizable Parameters: Modify WACC, growth rates, and tax assumptions to explore different scenarios.
- Financial Statements: Complete annual and quarterly breakdowns for enhanced insights.
- Key Ratios: Integrated analysis for profitability, efficiency, and leverage metrics.
- Dashboard with Visual Outputs: Charts and tables designed for clear, actionable results.
Disclaimer
All information, articles, and product details provided on this website are for general informational and educational purposes only. We do not claim any ownership over, nor do we intend to infringe upon, any trademarks, copyrights, logos, brand names, or other intellectual property mentioned or depicted on this site. Such intellectual property remains the property of its respective owners, and any references here are made solely for identification or informational purposes, without implying any affiliation, endorsement, or partnership.
We make no representations or warranties, express or implied, regarding the accuracy, completeness, or suitability of any content or products presented. Nothing on this website should be construed as legal, tax, investment, financial, medical, or other professional advice. In addition, no part of this site—including articles or product references—constitutes a solicitation, recommendation, endorsement, advertisement, or offer to buy or sell any securities, franchises, or other financial instruments, particularly in jurisdictions where such activity would be unlawful.
All content is of a general nature and may not address the specific circumstances of any individual or entity. It is not a substitute for professional advice or services. Any actions you take based on the information provided here are strictly at your own risk. You accept full responsibility for any decisions or outcomes arising from your use of this website and agree to release us from any liability in connection with your use of, or reliance upon, the content or products found herein.