
|
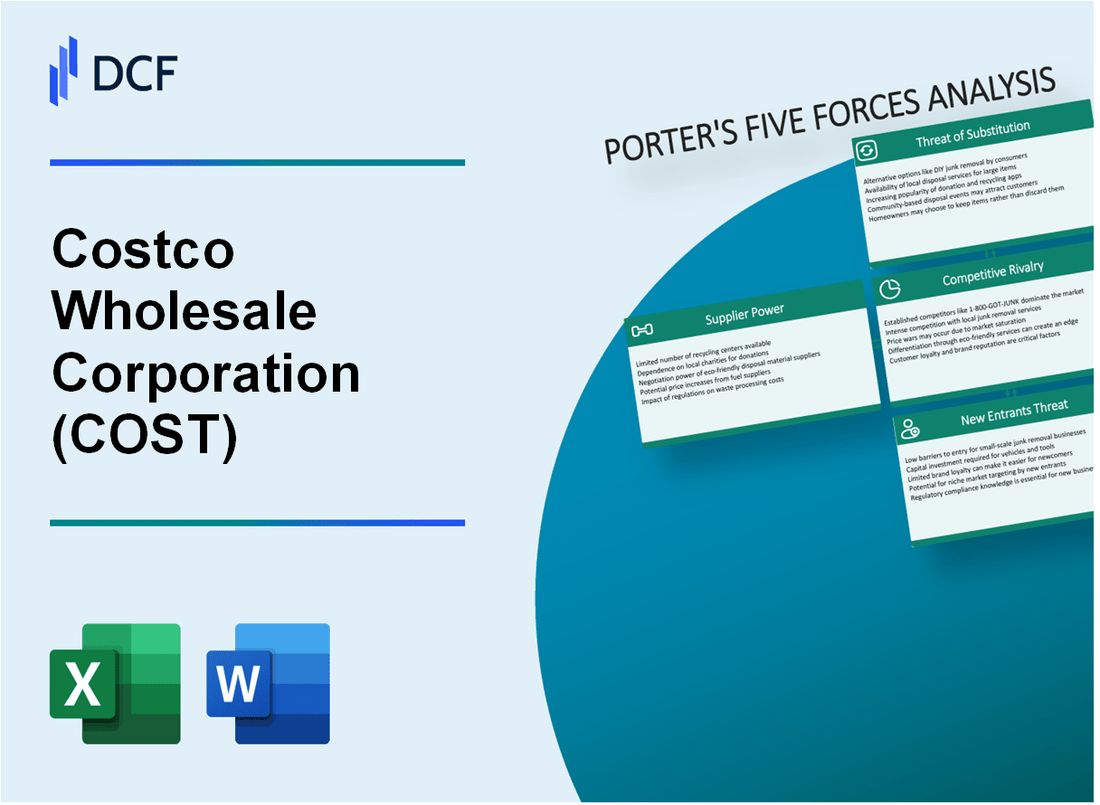
Costco Wholesale Corporation (COST): 5 Forces Analysis [Jan-2025 Updated] |
Fully Editable: Tailor To Your Needs In Excel Or Sheets
Professional Design: Trusted, Industry-Standard Templates
Investor-Approved Valuation Models
MAC/PC Compatible, Fully Unlocked
No Expertise Is Needed; Easy To Follow
Costco Wholesale Corporation (COST) Bundle
Dive into the strategic landscape of Costco Wholesale Corporation, where marketplace dynamics are shaped by an intricate interplay of competitive forces. In this deep-dive analysis, we'll unravel how Costco navigates the complex terrain of supplier relationships, customer power, market rivalry, potential substitutes, and new entrants—revealing the strategic brilliance behind their $226 billion global retail empire. From their membership-driven model to their laser-focused low-cost strategy, Costco demonstrates a masterclass in maintaining competitive advantage in the cutthroat wholesale retail sector.
Costco Wholesale Corporation (COST) - Porter's Five Forces: Bargaining power of suppliers
Supplier Concentration and Purchasing Volume
Costco's annual purchasing volume reached $222 billion in fiscal year 2023. The company purchases approximately 90% of products directly from manufacturers, bypassing traditional distribution channels.
| Supplier Metric | Value |
|---|---|
| Total Suppliers | 2,500+ global suppliers |
| Annual Purchasing Volume | $222 billion |
| Direct Manufacturer Purchases | 90% |
Negotiation Leverage
Costco maintains significant negotiating power through bulk purchasing strategies.
- Average inventory turnover rate: 13.1 times per year
- Bulk purchase discounts range between 15-40%
- Negotiates fixed pricing contracts with major suppliers
Global Supplier Diversification
Costco sources products from 24 countries across multiple continents, reducing dependency on single geographic regions.
| Supplier Geographic Distribution | Percentage |
|---|---|
| North America | 52% |
| Asia | 28% |
| Europe | 15% |
| Other Regions | 5% |
Long-Term Supplier Relationships
Average supplier relationship duration: 12-15 years, with many strategic partners maintaining multi-decade collaborations.
- Preferred supplier agreements with 350+ strategic manufacturers
- Collaborative product development initiatives
- Consistent payment terms: Net 30-45 days
Costco Wholesale Corporation (COST) - Porter's Five Forces: Bargaining power of customers
Price-sensitive Members with Annual Membership Requirements
Costco reported 64.4 million total cardholders in fiscal year 2023, with 118.1 million membership households globally. Annual membership fees range from $60 to $120 per year.
| Membership Tier | Annual Fee | Percentage of Members |
|---|---|---|
| Gold Star | $60 | 58% |
| Executive | $120 | 42% |
High Customer Loyalty through Membership Model
Costco maintains a 90.4% membership renewal rate globally in 2023, with 92.3% renewal rate in the United States and Canada.
Significant Purchasing Power through Bulk Buying Options
- Average transaction value: $342 per visit
- Typical household saves 30-35% compared to traditional retail pricing
- Annual merchandise sales: $238.39 billion in fiscal year 2023
Transparent Pricing Strategy
Costco markup averages 10-15% on products, compared to 25-50% in traditional retail, with $4.75 billion in net sales from membership fees in 2023.
Costco Wholesale Corporation (COST) - Porter's Five Forces: Competitive rivalry
Competitive Landscape Overview
As of 2024, Costco faces significant competitive rivalry from major retailers:
| Competitor | Annual Revenue | Market Share |
|---|---|---|
| Walmart (Sam's Club) | $611.3 billion | 12.7% |
| Amazon | $574.8 billion | 11.5% |
| Target | $109.1 billion | 2.3% |
Competitive Differentiation Strategies
Costco's unique competitive positioning includes:
- Membership-based wholesale model generating $4.3 billion in membership fees in 2023
- Average warehouse sales of $279.7 million per location
- Low-price strategy with gross margin of 11.1%
Operational Efficiency Metrics
Costco's competitive advantages:
| Metric | Value |
|---|---|
| Marketing Expenses | 0.9% of revenue |
| Operating Margin | 4.2% |
| Total Warehouses | 848 locations globally |
Market Performance Indicators
Competitive performance metrics:
- Annual revenue: $242.3 billion in 2023
- Net income: $5.4 billion
- Stock price performance: 22.6% annual return
Costco Wholesale Corporation (COST) - Porter's Five Forces: Threat of substitutes
Online e-commerce platforms offering similar product ranges
Amazon's online retail market share in 2023: 37.8% of total U.S. e-commerce sales. Walmart.com online sales: $73.2 billion in 2022. Target.com online sales: $25.4 billion in 2022.
| E-commerce Platform | Annual Online Sales | Market Share |
|---|---|---|
| Amazon | $514 billion | 37.8% |
| Walmart.com | $73.2 billion | 6.3% |
| Target.com | $25.4 billion | 2.2% |
Traditional retail stores providing comparable merchandise
Sam's Club membership: 47 million members. BJ's Wholesale Club membership: 6.5 million members. Walmart retail store count: 10,524 stores globally.
- Sam's Club total revenue in 2023: $57.8 billion
- BJ's Wholesale Club revenue in 2023: $4.85 billion
- Target total revenue in 2022: $109.1 billion
Growing digital shopping alternatives
U.S. e-commerce sales growth in 2022: 10.8%. Mobile commerce sales: $359.3 billion in 2021. Projected mobile commerce sales in 2025: $710 billion.
| Digital Shopping Channel | 2022 Sales Volume | Growth Rate |
|---|---|---|
| Mobile Commerce | $359.3 billion | 15.2% |
| Social Commerce | $45.7 billion | 22.5% |
Emerging discount retailers and warehouse clubs
Dollar General store count: 18,216 stores. Dollar Tree/Family Dollar combined store count: 16,402 stores. Aldi U.S. store count: 2,200 stores.
- Dollar General 2022 revenue: $34.2 billion
- Dollar Tree/Family Dollar 2022 revenue: $27.3 billion
- Aldi U.S. estimated annual revenue: $20 billion
Costco Wholesale Corporation (COST) - Porter's Five Forces: Threat of new entrants
High Initial Capital Requirements for Warehouse Infrastructure
Costco requires approximately $20-30 million in initial capital investment per warehouse location. The average warehouse size is 146,000 square feet, with construction and equipment costs ranging from $15-25 million per facility.
| Infrastructure Cost Component | Estimated Investment |
|---|---|
| Land Acquisition | $3-5 million |
| Building Construction | $10-15 million |
| Initial Inventory | $5-7 million |
| Equipment and Technology | $2-3 million |
Significant Economies of Scale Needed to Compete
Costco operates with 574 warehouses globally, generating $226.95 billion in revenue for fiscal year 2023. The company requires massive scale to maintain competitive pricing.
- Minimum annual revenue to compete effectively: $100 billion
- Gross margin percentage: 11.04%
- Operating margin: 4.09%
Complex Logistics and Distribution Network Barriers
Costco maintains 48 distribution centers across North America, with an advanced supply chain infrastructure requiring significant technological investment.
| Distribution Network Metric | Quantity |
|---|---|
| Total Distribution Centers | 48 |
| Annual Shipping Volume | 67 million containers |
| Transportation Spend | $4.2 billion annually |
Established Brand Loyalty and Membership Model
Costco's membership program generates substantial recurring revenue with 67.4 million total cardholders as of 2023.
- Gold Star Membership Price: $60 annually
- Executive Membership Price: $120 annually
- Membership Renewal Rate: 90.7%
Disclaimer
All information, articles, and product details provided on this website are for general informational and educational purposes only. We do not claim any ownership over, nor do we intend to infringe upon, any trademarks, copyrights, logos, brand names, or other intellectual property mentioned or depicted on this site. Such intellectual property remains the property of its respective owners, and any references here are made solely for identification or informational purposes, without implying any affiliation, endorsement, or partnership.
We make no representations or warranties, express or implied, regarding the accuracy, completeness, or suitability of any content or products presented. Nothing on this website should be construed as legal, tax, investment, financial, medical, or other professional advice. In addition, no part of this site—including articles or product references—constitutes a solicitation, recommendation, endorsement, advertisement, or offer to buy or sell any securities, franchises, or other financial instruments, particularly in jurisdictions where such activity would be unlawful.
All content is of a general nature and may not address the specific circumstances of any individual or entity. It is not a substitute for professional advice or services. Any actions you take based on the information provided here are strictly at your own risk. You accept full responsibility for any decisions or outcomes arising from your use of this website and agree to release us from any liability in connection with your use of, or reliance upon, the content or products found herein.