
|
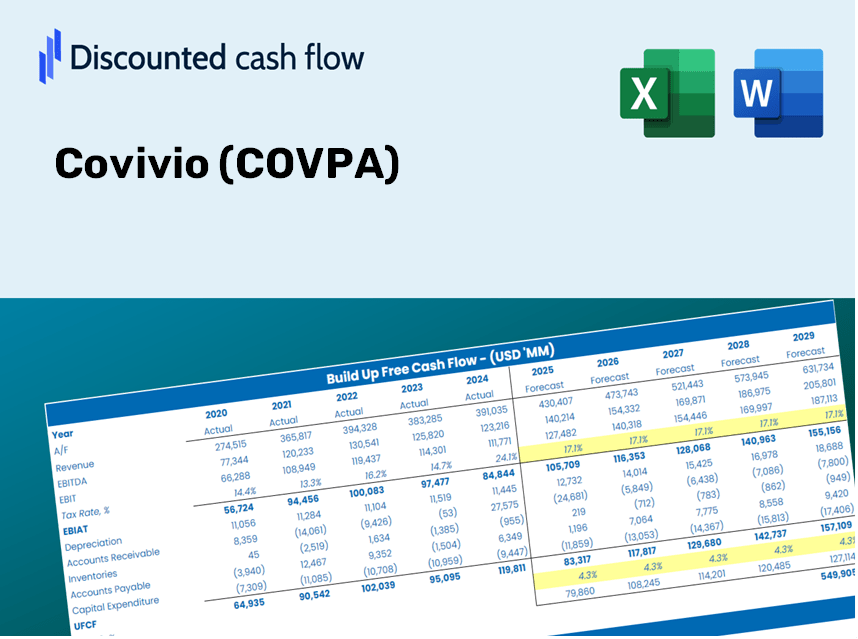
Covivio (COV.PA) DCF Valuation |
Fully Editable: Tailor To Your Needs In Excel Or Sheets
Professional Design: Trusted, Industry-Standard Templates
Investor-Approved Valuation Models
MAC/PC Compatible, Fully Unlocked
No Expertise Is Needed; Easy To Follow
Covivio (COV.PA) Bundle
Discover the true value of Covivio (COVPA) with our advanced DCF Calculator! Adjust key assumptions, explore various scenarios, and evaluate how changes affect Covivio (COVPA) valuation – all within a single Excel template.
What You Will Receive
- Pre-Filled Financial Model: Covivio’s actual data facilitates accurate DCF valuation.
- Complete Forecast Control: Modify revenue growth, profit margins, WACC, and other essential factors.
- Real-Time Calculations: Automatic updates provide immediate results as adjustments are made.
- Investor-Ready Template: A polished Excel file crafted for high-level valuation needs.
- Customizable and Reusable: Designed for adaptability, perfect for multiple detailed forecasts.
Covivio's Key Features
- Customizable Financial Metrics: Adjust essential parameters such as occupancy rates, rental income growth, and capital investment.
- Instant DCF Valuation: Quickly determines intrinsic value, net present value (NPV), and additional financial metrics.
- High Precision Analysis: Leverages Covivio’s actual financial data for accurate valuation insights.
- Effortless Scenario Testing: Easily evaluate various assumptions and analyze the resulting impact.
- Efficiency Tool: Avoid the complexities of constructing detailed valuation models from the ground up.
How It Functions
- 1. Download the Template: Obtain and open the Excel file containing Covivio’s preloaded data.
- 2. Adjust Key Assumptions: Modify essential inputs such as growth rates, WACC, and capital expenditures.
- 3. See Results in Real-Time: The DCF model automatically computes the intrinsic value and NPV.
- 4. Explore Different Scenarios: Analyze various forecasts to evaluate distinct valuation outcomes.
- 5. Present with Assurance: Share professional valuation insights to reinforce your decision-making.
Why Choose Covivio's Calculator?
- Time-Saving: Skip the hassle of building a DCF model from the ground up – it’s user-ready.
- Enhanced Accuracy: Dependable financial data and formulas minimize valuation errors.
- Completely Customizable: Adjust the model to align with your specific assumptions and forecasts.
- User-Friendly: Intuitive charts and outputs ensure the results are easy to understand.
- Endorsed by Professionals: Crafted for those who prioritize both precision and convenience.
Who Can Benefit from This Product?
- Institutional Investors: Create comprehensive and accurate valuation models for portfolio assessment in Covivio (COVPA).
- Corporate Finance Departments: Evaluate valuation scenarios to inform strategic decisions within the organization.
- Consultants and Financial Advisors: Equip clients with precise valuation analyses for Covivio (COVPA) stock.
- Students and Instructors: Leverage real market data to enhance skills in financial modeling and education.
- Real Estate Enthusiasts: Gain insights into how real estate companies like Covivio (COVPA) are valued in the market.
Contents of the Template
- Operating and Balance Sheet Data: Pre-filled historical data and forecasts for Covivio (COVPA), including metrics such as revenue, EBITDA, EBIT, and capital expenditures.
- WACC Calculation: A dedicated sheet for calculating the Weighted Average Cost of Capital (WACC), featuring key parameters like Beta, risk-free rate, and share price.
- DCF Valuation (Unlevered and Levered): Customizable Discounted Cash Flow models that provide intrinsic value calculations with comprehensive details.
- Financial Statements: Pre-loaded financial statements (annual and quarterly) specifically for analysis of Covivio (COVPA).
- Key Ratios: A collection of profitability, leverage, and efficiency ratios for Covivio (COVPA).
- Dashboard and Charts: A visual overview of valuation results and underlying assumptions to facilitate easy analysis.
Disclaimer
All information, articles, and product details provided on this website are for general informational and educational purposes only. We do not claim any ownership over, nor do we intend to infringe upon, any trademarks, copyrights, logos, brand names, or other intellectual property mentioned or depicted on this site. Such intellectual property remains the property of its respective owners, and any references here are made solely for identification or informational purposes, without implying any affiliation, endorsement, or partnership.
We make no representations or warranties, express or implied, regarding the accuracy, completeness, or suitability of any content or products presented. Nothing on this website should be construed as legal, tax, investment, financial, medical, or other professional advice. In addition, no part of this site—including articles or product references—constitutes a solicitation, recommendation, endorsement, advertisement, or offer to buy or sell any securities, franchises, or other financial instruments, particularly in jurisdictions where such activity would be unlawful.
All content is of a general nature and may not address the specific circumstances of any individual or entity. It is not a substitute for professional advice or services. Any actions you take based on the information provided here are strictly at your own risk. You accept full responsibility for any decisions or outcomes arising from your use of this website and agree to release us from any liability in connection with your use of, or reliance upon, the content or products found herein.