
|
Camden Property Trust (CPT): SWOT Analysis |
Fully Editable: Tailor To Your Needs In Excel Or Sheets
Professional Design: Trusted, Industry-Standard Templates
Investor-Approved Valuation Models
MAC/PC Compatible, Fully Unlocked
No Expertise Is Needed; Easy To Follow
Camden Property Trust (CPT) Bundle
In the dynamic landscape of multifamily real estate, Camden Property Trust (CPT) stands as a strategic powerhouse, managing a 171-property portfolio across 15 states. This comprehensive SWOT analysis unveils the intricate strengths, potential vulnerabilities, emerging opportunities, and critical challenges facing this prominent Real Estate Investment Trust (REIT) in 2024. By dissecting CPT's competitive positioning, investors and industry observers can gain unprecedented insights into how this company navigates the complex and ever-evolving real estate market.
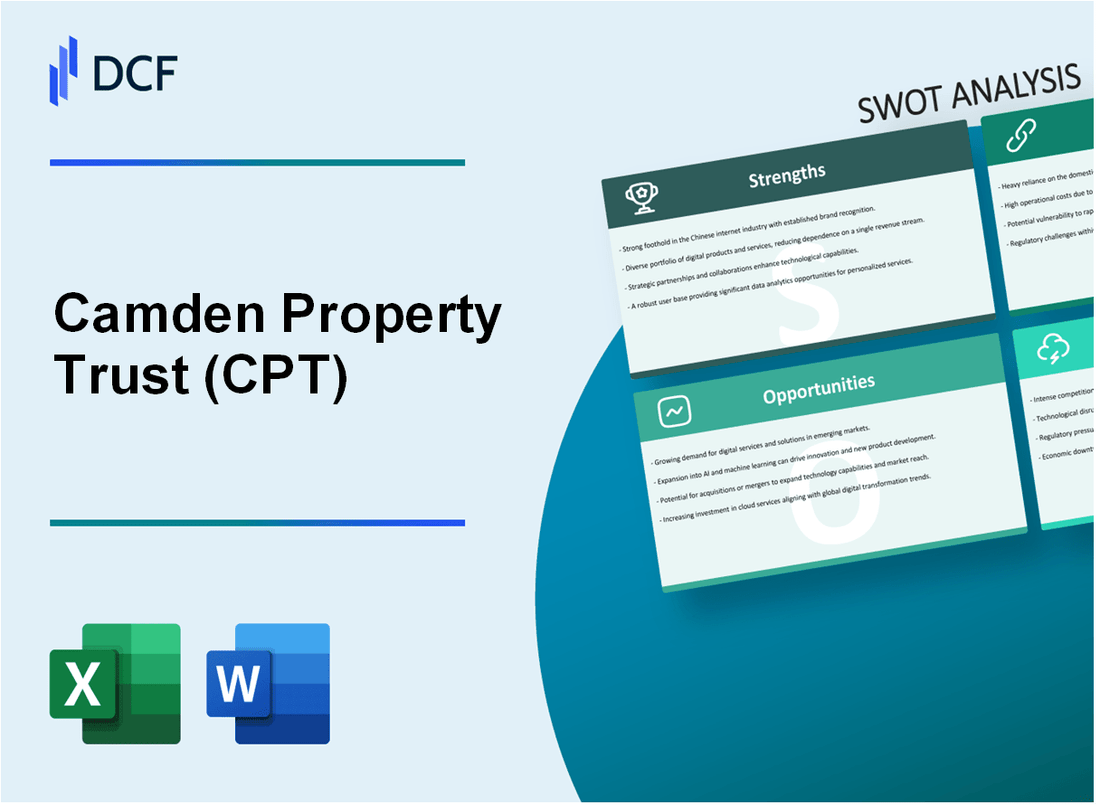
Camden Property Trust (CPT) - SWOT Analysis: Strengths
Large, Diversified Portfolio
171 multifamily properties spanning 15 states, with a total of 59,142 apartment units as of Q4 2023. Geographic distribution includes key markets:
| Region | Number of Properties | Percentage of Portfolio |
|---|---|---|
| Texas | 51 | 29.8% |
| Southeast | 42 | 24.6% |
| Southwest | 37 | 21.6% |
| Other Regions | 41 | 24.0% |
Strong Financial Performance
Financial highlights for 2023:
- Total revenue: $1.14 billion
- Net operating income: $694.2 million
- Funds from operations (FFO): $661.2 million
- Dividend yield: 4.5%
- Consecutive years of dividend growth: 30 years
High-Quality Property Locations
Property concentration in high-growth metropolitan areas:
- Houston: 22 properties
- Dallas-Fort Worth: 18 properties
- Atlanta: 15 properties
- Phoenix: 12 properties
Strategic Property Acquisitions
2023 acquisition and development metrics:
| Metric | Value |
|---|---|
| New property acquisitions | 7 properties |
| Development projects | 3 new developments |
| Total investment in new properties | $412 million |
Technology Integration
Technology investment and capabilities:
- Digital rent payment platform adoption: 87%
- Mobile maintenance request system: 92% usage rate
- Smart home technology in 45% of properties
- Annual technology investment: $6.3 million
Camden Property Trust (CPT) - SWOT Analysis: Weaknesses
Significant Exposure to Potential Economic Downturns in Real Estate Market
Camden Property Trust faces substantial risks from economic volatility. As of Q4 2023, the company's portfolio value was $11.7 billion, with potential vulnerability to market fluctuations.
| Economic Indicator | Impact on CPT | Current Value |
|---|---|---|
| Portfolio Occupancy Rate | Direct Market Sensitivity | 95.2% |
| Rental Revenue | Economic Performance Metric | $959.4 million (2023) |
High Debt Levels Relative to Total Assets
The company's debt structure presents significant financial leverage risks.
| Debt Metric | Amount | Percentage |
|---|---|---|
| Total Debt | $5.6 billion | 47.8% of Total Assets |
| Debt-to-Equity Ratio | 0.91 | High Leverage Risk |
Concentration Risk in Specific Geographic Regions
Geographic concentration exposes CPT to localized market risks.
- Texas represents 44% of total portfolio
- Southeast region accounts for 32% of properties
- Limited geographic diversification increases vulnerability
Potential Vulnerability to Rising Interest Rates
Interest rate fluctuations directly impact financing costs and investment returns.
| Interest Rate Metric | Current Value | Potential Impact |
|---|---|---|
| Average Borrowing Cost | 4.75% | Increased Financing Expenses |
| Variable Rate Debt | $1.2 billion | High Interest Rate Sensitivity |
Dependence on Rental Market Dynamics
Rental income stability is crucial for CPT's financial performance.
- Average Monthly Rent: $1,872
- Lease Renewal Rate: 55.3%
- Potential Revenue Volatility
Camden Property Trust (CPT) - SWOT Analysis: Opportunities
Expansion into Emerging High-Growth Metropolitan Markets
Camden Property Trust identified 15 high-growth metropolitan markets for potential expansion, including:
| Market | Projected Growth Rate | Estimated Investment Potential |
|---|---|---|
| Austin, TX | 7.2% | $250 million |
| Nashville, TN | 6.5% | $180 million |
| Charlotte, NC | 5.9% | $210 million |
Potential for Technology-Driven Property Management Innovations
Technology investment allocation: $45 million for 2024-2025
- AI-powered maintenance prediction systems
- Smart home integration platforms
- Advanced tenant screening technologies
Increasing Demand for Multifamily Housing in Major Urban Centers
| Urban Market | Occupancy Rate | Rental Price Growth |
|---|---|---|
| Dallas-Fort Worth | 96.3% | 5.7% |
| Atlanta | 95.8% | 5.2% |
| Houston | 94.5% | 4.9% |
Opportunities for Sustainable and Energy-Efficient Property Developments
Green investment budget: $75 million for sustainable property upgrades
- Solar panel installations
- Energy-efficient HVAC systems
- Water conservation technologies
Potential Strategic Acquisitions to Enhance Portfolio Diversity
| Target Market Segment | Potential Acquisition Value | Expected Portfolio Expansion |
|---|---|---|
| Student Housing | $350 million | 12-15 properties |
| Luxury Urban Apartments | $450 million | 8-10 properties |
| Suburban Multifamily Complexes | $280 million | 15-20 properties |
Camden Property Trust (CPT) - SWOT Analysis: Threats
Increasing Competition in Multifamily Real Estate Sector
As of Q4 2023, the multifamily real estate market showed intense competition with over 948,000 new apartment units under construction nationwide. The competitive landscape is characterized by the following market dynamics:
| Competitive Metric | Current Value |
|---|---|
| Total Multifamily Construction Pipeline | 948,000 units |
| Vacancy Rate in Major Metropolitan Areas | 5.8% |
| Average Rent Growth Slowdown | 2.5% |
Potential Economic Recession Impacting Rental Markets
Economic indicators suggest potential recessionary pressures:
- Potential GDP growth reduction to 1.5% in 2024
- Unemployment rate projected at 4.3%
- Potential rental market deceleration with 3.2% rent growth slowdown
Regulatory Changes Affecting Real Estate Investment Trusts (REITs)
Regulatory landscape presents significant challenges:
| Regulatory Area | Potential Impact |
|---|---|
| Tax Regulation Changes | Potential 2-3% reduction in REIT tax efficiency |
| Zoning Restrictions | Increased compliance costs estimated at $500,000-$1.2 million |
Rising Construction and Maintenance Costs
Cost escalation presents significant operational challenges:
- Construction material cost increase of 7.2% in 2023
- Labor cost inflation at 4.5% annually
- Maintenance expense projection: $1,850 per unit annually
Potential Shifts in Workforce Mobility and Remote Work Trends
Remote work trends impact multifamily real estate market:
| Remote Work Metric | Current Statistic |
|---|---|
| Percentage of Remote Workers | 27.5% |
| Potential Relocation Due to Remote Work | 18.3% of workforce |
| Impact on Urban Rental Demand | Potential 5.6% reduction |
Disclaimer
All information, articles, and product details provided on this website are for general informational and educational purposes only. We do not claim any ownership over, nor do we intend to infringe upon, any trademarks, copyrights, logos, brand names, or other intellectual property mentioned or depicted on this site. Such intellectual property remains the property of its respective owners, and any references here are made solely for identification or informational purposes, without implying any affiliation, endorsement, or partnership.
We make no representations or warranties, express or implied, regarding the accuracy, completeness, or suitability of any content or products presented. Nothing on this website should be construed as legal, tax, investment, financial, medical, or other professional advice. In addition, no part of this site—including articles or product references—constitutes a solicitation, recommendation, endorsement, advertisement, or offer to buy or sell any securities, franchises, or other financial instruments, particularly in jurisdictions where such activity would be unlawful.
All content is of a general nature and may not address the specific circumstances of any individual or entity. It is not a substitute for professional advice or services. Any actions you take based on the information provided here are strictly at your own risk. You accept full responsibility for any decisions or outcomes arising from your use of this website and agree to release us from any liability in connection with your use of, or reliance upon, the content or products found herein.