
|
Cheniere Energy Partners, L.P. (CQP) DCF Valuation |
Fully Editable: Tailor To Your Needs In Excel Or Sheets
Professional Design: Trusted, Industry-Standard Templates
Investor-Approved Valuation Models
MAC/PC Compatible, Fully Unlocked
No Expertise Is Needed; Easy To Follow
Cheniere Energy Partners, L.P. (CQP) Bundle
Designed for accuracy, our (CQP) DCF Calculator enables you to evaluate Cheniere Energy Partners, L.P. valuation using real-world financial insights, offering complete flexibility to modify all essential parameters for enhanced projections.
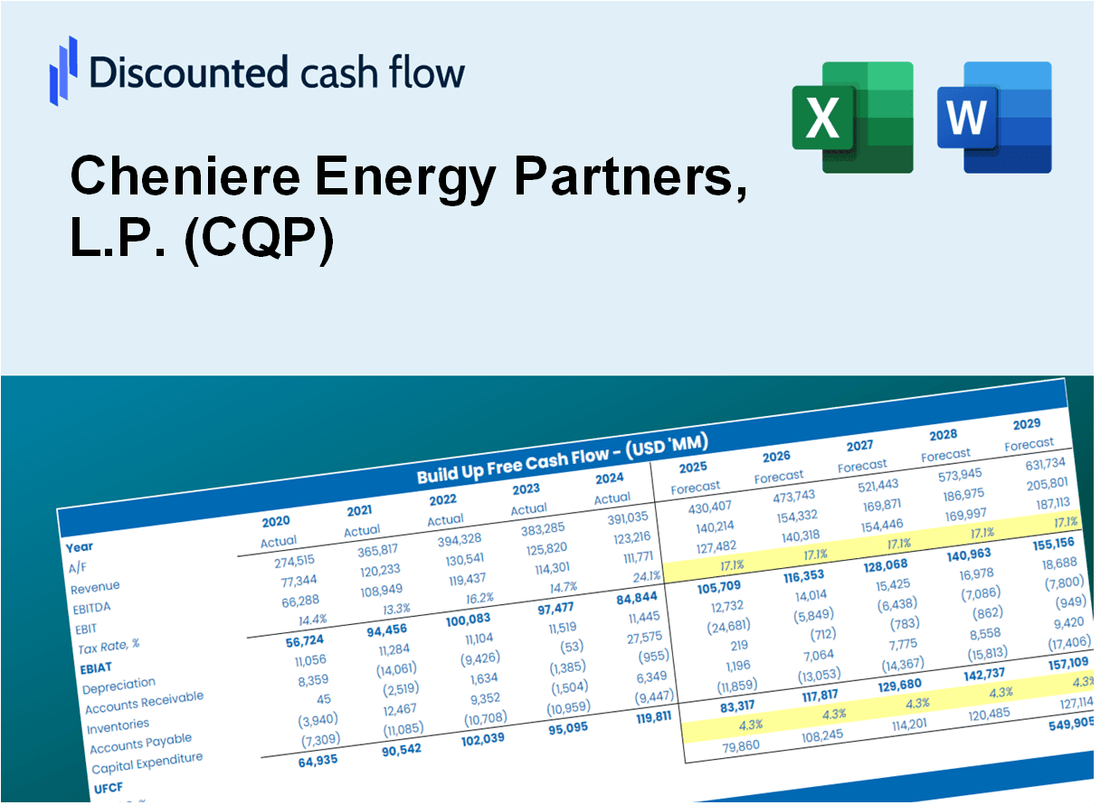
Discounted Cash Flow (DCF) - (USD MM)
| Year | AY1 2020 |
AY2 2021 |
AY3 2022 |
AY4 2023 |
AY5 2024 |
FY1 2025 |
FY2 2026 |
FY3 2027 |
FY4 2028 |
FY5 2029 |
|---|---|---|---|---|---|---|---|---|---|---|
| Revenue | 6,167.0 | 9,434.0 | 17,206.0 | 9,664.0 | 8,704.0 | 10,318.4 | 12,232.2 | 14,501.1 | 17,190.7 | 20,379.2 |
| Revenue Growth, % | 0 | 52.98 | 82.38 | -43.83 | -9.93 | 18.55 | 18.55 | 18.55 | 18.55 | 18.55 |
| EBITDA | 2,643.0 | 3,018.0 | 4,002.0 | 5,749.0 | 3,990.0 | 4,198.3 | 4,977.0 | 5,900.1 | 6,994.4 | 8,291.8 |
| EBITDA, % | 42.86 | 31.99 | 23.26 | 59.49 | 45.84 | 40.69 | 40.69 | 40.69 | 40.69 | 40.69 |
| Depreciation | 551.0 | 557.0 | 634.0 | 672.0 | 680.0 | 687.0 | 814.4 | 965.5 | 1,144.5 | 1,356.8 |
| Depreciation, % | 8.93 | 5.9 | 3.68 | 6.95 | 7.81 | 6.66 | 6.66 | 6.66 | 6.66 | 6.66 |
| EBIT | 2,092.0 | 2,461.0 | 3,368.0 | 5,077.0 | 3,310.0 | 3,511.3 | 4,162.6 | 4,934.6 | 5,849.9 | 6,934.9 |
| EBIT, % | 33.92 | 26.09 | 19.57 | 52.54 | 38.03 | 34.03 | 34.03 | 34.03 | 34.03 | 34.03 |
| Total Cash | 1,210.0 | 876.0 | 904.0 | 575.0 | 270.0 | 891.8 | 1,057.2 | 1,253.2 | 1,485.7 | 1,761.3 |
| Total Cash, percent | .0 | .0 | .0 | .0 | .0 | .0 | .0 | .0 | .0 | .0 |
| Account Receivables | 502.0 | 813.0 | 1,178.0 | 651.0 | 381.0 | 716.5 | 849.4 | 1,006.9 | 1,193.7 | 1,415.0 |
| Account Receivables, % | 8.14 | 8.62 | 6.85 | 6.74 | 4.38 | 6.94 | 6.94 | 6.94 | 6.94 | 6.94 |
| Inventories | 107.0 | 176.0 | 160.0 | 142.0 | 151.0 | 159.6 | 189.2 | 224.3 | 265.9 | 315.3 |
| Inventories, % | 1.74 | 1.87 | 0.92991 | 1.47 | 1.73 | 1.55 | 1.55 | 1.55 | 1.55 | 1.55 |
| Accounts Payable | 12.0 | 21.0 | 32.0 | 69.0 | 62.0 | 41.9 | 49.6 | 58.9 | 69.8 | 82.7 |
| Accounts Payable, % | 0.19458 | 0.2226 | 0.18598 | 0.71399 | 0.71232 | 0.40589 | 0.40589 | 0.40589 | 0.40589 | 0.40589 |
| Capital Expenditure | -972.0 | -648.0 | -451.0 | -220.0 | -154.0 | -604.6 | -716.7 | -849.7 | -1,007.3 | -1,194.1 |
| Capital Expenditure, % | -15.76 | -6.87 | -2.62 | -2.28 | -1.77 | -5.86 | -5.86 | -5.86 | -5.86 | -5.86 |
| Tax Rate, % | 0 | 0 | 0 | 0 | 0 | 0 | 0 | 0 | 0 | 0 |
| EBITAT | 2,092.0 | 2,461.0 | 3,368.0 | 5,077.0 | 3,310.0 | 3,511.3 | 4,162.6 | 4,934.6 | 5,849.9 | 6,934.9 |
| Depreciation | ||||||||||
| Changes in Account Receivables | ||||||||||
| Changes in Inventories | ||||||||||
| Changes in Accounts Payable | ||||||||||
| Capital Expenditure | ||||||||||
| UFCF | 1,074.0 | 1,999.0 | 3,213.0 | 6,111.0 | 4,090.0 | 3,229.5 | 4,105.5 | 4,867.0 | 5,769.7 | 6,839.9 |
| WACC, % | 5.39 | 5.39 | 5.39 | 5.39 | 5.39 | 5.39 | 5.39 | 5.39 | 5.39 | 5.39 |
| PV UFCF | ||||||||||
| SUM PV UFCF | 20,856.3 | |||||||||
| Long Term Growth Rate, % | 2.00 | |||||||||
| Free cash flow (T + 1) | 6,977 | |||||||||
| Terminal Value | 205,820 | |||||||||
| Present Terminal Value | 158,306 | |||||||||
| Enterprise Value | 179,162 | |||||||||
| Net Debt | 14,842 | |||||||||
| Equity Value | 164,320 | |||||||||
| Diluted Shares Outstanding, MM | 484 | |||||||||
| Equity Value Per Share | 339.50 |
What You Will Get
- Editable Forecast Inputs: Easily modify assumptions (growth %, margins, WACC) to create various scenarios.
- Real-World Data: Cheniere Energy Partners, L.P.’s (CQP) financial data pre-filled to kickstart your analysis.
- Automatic DCF Outputs: The template computes Net Present Value (NPV) and intrinsic value for you.
- Customizable and Professional: A refined Excel model that adjusts to your valuation requirements.
- Built for Analysts and Investors: Perfect for testing projections, validating strategies, and enhancing efficiency.
Key Features
- Real-Life CQP Data: Pre-filled with Cheniere Energy Partners' historical financials and forward-looking projections.
- Fully Customizable Inputs: Adjust revenue growth, margins, WACC, tax rates, and capital expenditures.
- Dynamic Valuation Model: Automatic updates to Net Present Value (NPV) and intrinsic value based on your inputs.
- Scenario Testing: Create multiple forecast scenarios to analyze different valuation outcomes.
- User-Friendly Design: Simple, structured, and designed for professionals and beginners alike.
How It Works
- Step 1: Download the Excel file.
- Step 2: Review Cheniere Energy Partners, L.P.'s (CQP) pre-filled financial data and forecasts.
- Step 3: Modify key inputs such as revenue growth, WACC, and tax rates (highlighted cells).
- Step 4: Observe the DCF model update in real-time as you adjust assumptions.
- Step 5: Evaluate the outputs and leverage the results for your investment strategies.
Why Choose Cheniere Energy Partners, L.P. (CQP)?
- Industry Leader: A prominent player in the LNG sector with a strong market presence.
- Robust Financials: Consistent revenue growth and solid financial performance enhance investor confidence.
- Strategic Partnerships: Collaborations with key industry players ensure sustainable operations and expansion.
- Environmental Commitment: Focused on reducing carbon footprint and promoting cleaner energy solutions.
- Expert Management Team: Led by seasoned professionals with extensive experience in the energy sector.
Who Should Use Cheniere Energy Partners, L.P. (CQP)?
- Energy Investors: Make informed investment choices with insights into the LNG market.
- Market Analysts: Utilize comprehensive data to evaluate Cheniere's performance and growth potential.
- Consultants: Easily modify reports and presentations to meet client needs in the energy sector.
- Energy Sector Enthusiasts: Enhance your knowledge of liquefied natural gas operations and their impact on the market.
- Academics and Students: Leverage real-world case studies for a deeper understanding of energy finance.
What the Template Contains
- Preloaded CQP Data: Historical and projected financial data, including revenue, EBITDA, and capital expenditures.
- DCF and WACC Models: Professional-grade sheets for calculating intrinsic value and Weighted Average Cost of Capital.
- Editable Inputs: Yellow-highlighted cells for adjusting revenue growth, tax rates, and discount rates.
- Financial Statements: Comprehensive annual and quarterly financials for deeper analysis.
- Key Ratios: Profitability, leverage, and efficiency ratios to evaluate performance.
- Dashboard and Charts: Visual summaries of valuation outcomes and assumptions.
Disclaimer
All information, articles, and product details provided on this website are for general informational and educational purposes only. We do not claim any ownership over, nor do we intend to infringe upon, any trademarks, copyrights, logos, brand names, or other intellectual property mentioned or depicted on this site. Such intellectual property remains the property of its respective owners, and any references here are made solely for identification or informational purposes, without implying any affiliation, endorsement, or partnership.
We make no representations or warranties, express or implied, regarding the accuracy, completeness, or suitability of any content or products presented. Nothing on this website should be construed as legal, tax, investment, financial, medical, or other professional advice. In addition, no part of this site—including articles or product references—constitutes a solicitation, recommendation, endorsement, advertisement, or offer to buy or sell any securities, franchises, or other financial instruments, particularly in jurisdictions where such activity would be unlawful.
All content is of a general nature and may not address the specific circumstances of any individual or entity. It is not a substitute for professional advice or services. Any actions you take based on the information provided here are strictly at your own risk. You accept full responsibility for any decisions or outcomes arising from your use of this website and agree to release us from any liability in connection with your use of, or reliance upon, the content or products found herein.