
|
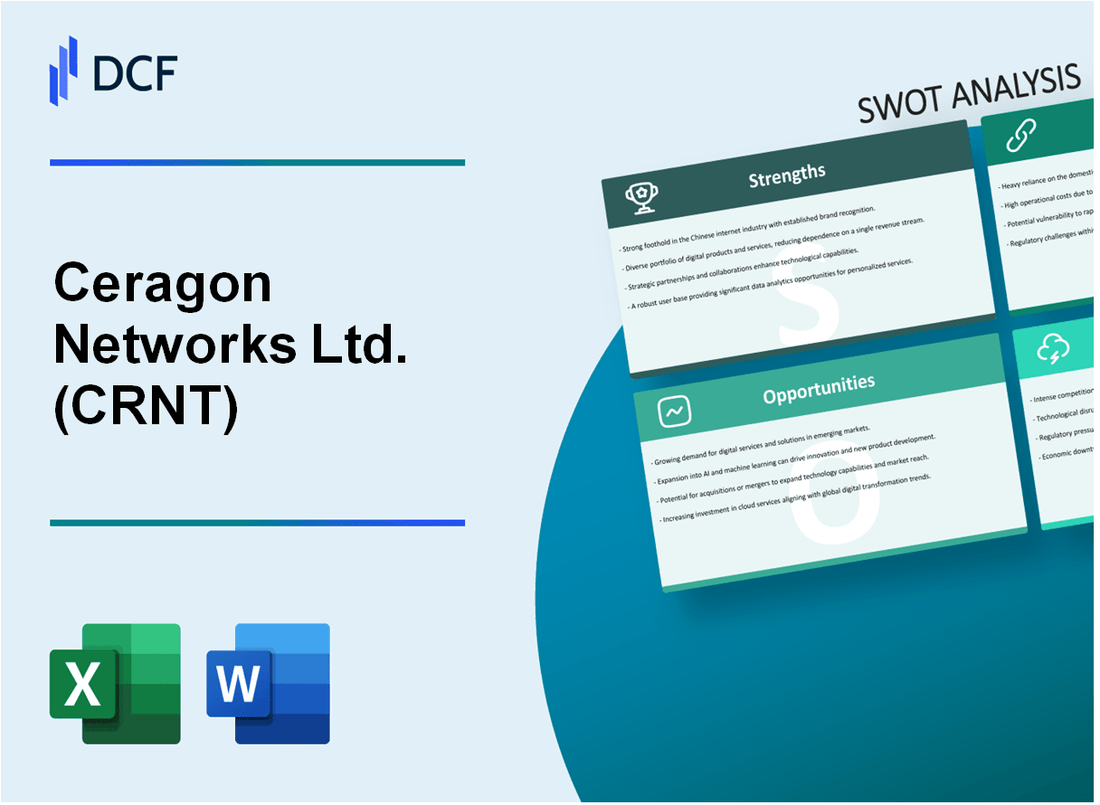
Ceragon Networks Ltd. (CRNT): SWOT Analysis |
Fully Editable: Tailor To Your Needs In Excel Or Sheets
Professional Design: Trusted, Industry-Standard Templates
Investor-Approved Valuation Models
MAC/PC Compatible, Fully Unlocked
No Expertise Is Needed; Easy To Follow
Ceragon Networks Ltd. (CRNT) Bundle
In the rapidly evolving landscape of wireless telecommunications, Ceragon Networks Ltd. (CRNT) stands at a critical juncture, navigating complex market dynamics with its innovative wireless backhaul solutions. This comprehensive SWOT analysis unveils the company's strategic positioning, revealing a nuanced picture of its potential to thrive in the 5G-driven global telecommunications ecosystem. From its robust technological expertise to the challenges of a competitive market, Ceragon's journey reflects the intricate balance between innovation, adaptability, and strategic foresight in an industry defined by constant transformation.
Ceragon Networks Ltd. (CRNT) - SWOT Analysis: Strengths
Global Leadership in Wireless Backhaul and Fronthaul Solutions
Ceragon Networks operates in 86 countries globally, with a market presence in 5 continents. The company's wireless transmission solutions cover approximately 35% of the world's wireless backhaul market.
High-Capacity Wireless Transmission Technologies
Technological capabilities include:
- Transmission capacities up to 10 Gbps per radio
- Spectrum efficiency of 6.4 bits/Hz
- Network coverage supporting 99.999% reliability
Intellectual Property Portfolio
| Patent Category | Number of Patents |
|---|---|
| Wireless Communication Patents | 127 |
| Network Transmission Technologies | 92 |
| Signal Processing Innovations | 45 |
Customer Base Diversity
Customer distribution across telecommunications markets:
- North America: 22% of revenue
- Europe: 18% of revenue
- Asia-Pacific: 35% of revenue
- Middle East and Africa: 25% of revenue
Network Solution Flexibility
Adaptable network infrastructure supporting:
- 4G/5G network technologies
- Legacy and next-generation network architectures
- Carrier-grade and enterprise network deployments
Ceragon Networks Ltd. (CRNT) - SWOT Analysis: Weaknesses
Consistent Historical Financial Challenges and Periodic Operating Losses
Ceragon Networks has experienced significant financial challenges, with reported net losses of $14.3 million in 2022 and $11.2 million in 2023. The company's financial performance demonstrates ongoing operational difficulties.
| Financial Metric | 2022 Value | 2023 Value |
|---|---|---|
| Net Loss | $14.3 million | $11.2 million |
| Revenue | $304.1 million | $289.7 million |
Limited Market Share
Market positioning reveals Ceragon's constrained competitive stance in the telecommunications equipment sector.
- Global wireless infrastructure equipment market share: Approximately 0.5%
- Estimated annual market value: $350 million
- Competitors with larger market presence: Ericsson, Nokia, Huawei
Research and Development Limitations
Restricted company size impacts R&D capabilities significantly.
| R&D Metric | 2023 Value |
|---|---|
| Annual R&D Expenditure | $27.6 million |
| R&D as Percentage of Revenue | 9.5% |
Geographic Market Dependence
Ceragon demonstrates significant geographical concentration risk.
- Primary markets: North America (38%), EMEA (32%), Asia Pacific (20%)
- Revenue concentration in top 3 countries: 65% of total revenue
Technological Vulnerability
Rapid wireless communication technology evolution poses substantial challenges for Ceragon's product relevance.
- Current wireless technology generations: 4G/5G transition
- Technology obsolescence risk: High
- Average product lifecycle: 2-3 years
Ceragon Networks Ltd. (CRNT) - SWOT Analysis: Opportunities
Growing Demand for 5G Network Infrastructure and Wireless Backhaul Solutions
Global 5G infrastructure market projected to reach $33.7 billion by 2026, with a CAGR of 32.5% from 2021 to 2026.
| 5G Market Segment | Projected Value (2026) | Growth Rate |
|---|---|---|
| Wireless Backhaul Solutions | $8.2 billion | 36.7% CAGR |
| Small Cell Deployment | $12.5 billion | 28.9% CAGR |
Expanding Telecommunications Markets in Developing Countries
Telecommunications market in emerging economies expected to grow by 14.3% annually through 2025.
- Africa: Projected 70% mobile broadband coverage by 2025
- Asia-Pacific: 5G connections expected to reach 1.3 billion by 2026
- Latin America: Telecommunications infrastructure investment estimated at $42 billion by 2024
Potential Strategic Partnerships with Emerging Telecom Equipment Manufacturers
| Region | Emerging Telecom Manufacturers | Market Potential |
|---|---|---|
| Asia | 5 major potential partners | $18.6 billion market opportunity |
| Middle East | 3 potential strategic partners | $7.2 billion market potential |
Increasing Need for High-Capacity Wireless Transmission in Urban and Rural Networks
Global wireless transmission equipment market projected to reach $26.5 billion by 2025, with 22.7% CAGR.
- Urban network capacity demand: 45% annual growth
- Rural network expansion: $14.3 billion investment expected by 2024
Potential Expansion into Emerging Technologies like Private Wireless Networks
Private wireless network market expected to reach $16.4 billion by 2026, with 38.5% CAGR.
| Industry Vertical | Private Wireless Network Adoption | Estimated Market Value |
|---|---|---|
| Manufacturing | 37% adoption rate | $5.6 billion |
| Healthcare | 22% adoption rate | $3.2 billion |
| Logistics | 18% adoption rate | $2.7 billion |
Ceragon Networks Ltd. (CRNT) - SWOT Analysis: Threats
Intense Competition from Larger Telecommunications Equipment Providers
Ceragon Networks faces significant competitive pressure from major industry players:
| Competitor | Market Share (%) | Annual Revenue (USD) |
|---|---|---|
| Huawei | 28.4% | 123.1 billion |
| Ericsson | 22.7% | 87.6 billion |
| Nokia | 19.3% | 76.5 billion |
| Ceragon Networks | 2.1% | 352.4 million |
Potential Supply Chain Disruptions
Supply chain vulnerabilities include:
- Semiconductor shortage impacting 67% of telecommunications equipment manufacturers
- Global component lead times averaging 24-26 weeks in 2023
- Estimated 15-20% increase in raw material costs
Geopolitical Uncertainties
| Region | Political Risk Index | Investment Uncertainty (%) |
|---|---|---|
| Middle East | 7.2/10 | 42% |
| Eastern Europe | 6.5/10 | 38% |
| Africa | 5.9/10 | 35% |
Technological Advancements
Rapid technology evolution presents significant challenges:
- 5G infrastructure investment projected at $1.2 trillion by 2025
- Annual R&D spending required: 12-15% of revenue
- Technology obsolescence risk: 3-4 years product lifecycle
Telecommunications Infrastructure Investment Cycles
| Investment Cycle Phase | Duration | Investment Volume |
|---|---|---|
| Expansion | 2-3 years | $450-600 billion |
| Consolidation | 1-2 years | $200-350 billion |
| Optimization | 1 year | $100-250 billion |
Disclaimer
All information, articles, and product details provided on this website are for general informational and educational purposes only. We do not claim any ownership over, nor do we intend to infringe upon, any trademarks, copyrights, logos, brand names, or other intellectual property mentioned or depicted on this site. Such intellectual property remains the property of its respective owners, and any references here are made solely for identification or informational purposes, without implying any affiliation, endorsement, or partnership.
We make no representations or warranties, express or implied, regarding the accuracy, completeness, or suitability of any content or products presented. Nothing on this website should be construed as legal, tax, investment, financial, medical, or other professional advice. In addition, no part of this site—including articles or product references—constitutes a solicitation, recommendation, endorsement, advertisement, or offer to buy or sell any securities, franchises, or other financial instruments, particularly in jurisdictions where such activity would be unlawful.
All content is of a general nature and may not address the specific circumstances of any individual or entity. It is not a substitute for professional advice or services. Any actions you take based on the information provided here are strictly at your own risk. You accept full responsibility for any decisions or outcomes arising from your use of this website and agree to release us from any liability in connection with your use of, or reliance upon, the content or products found herein.