
|
Cisco Systems, Inc. (CSCO) DCF Valuation |
Fully Editable: Tailor To Your Needs In Excel Or Sheets
Professional Design: Trusted, Industry-Standard Templates
Investor-Approved Valuation Models
MAC/PC Compatible, Fully Unlocked
No Expertise Is Needed; Easy To Follow
Cisco Systems, Inc. (CSCO) Bundle
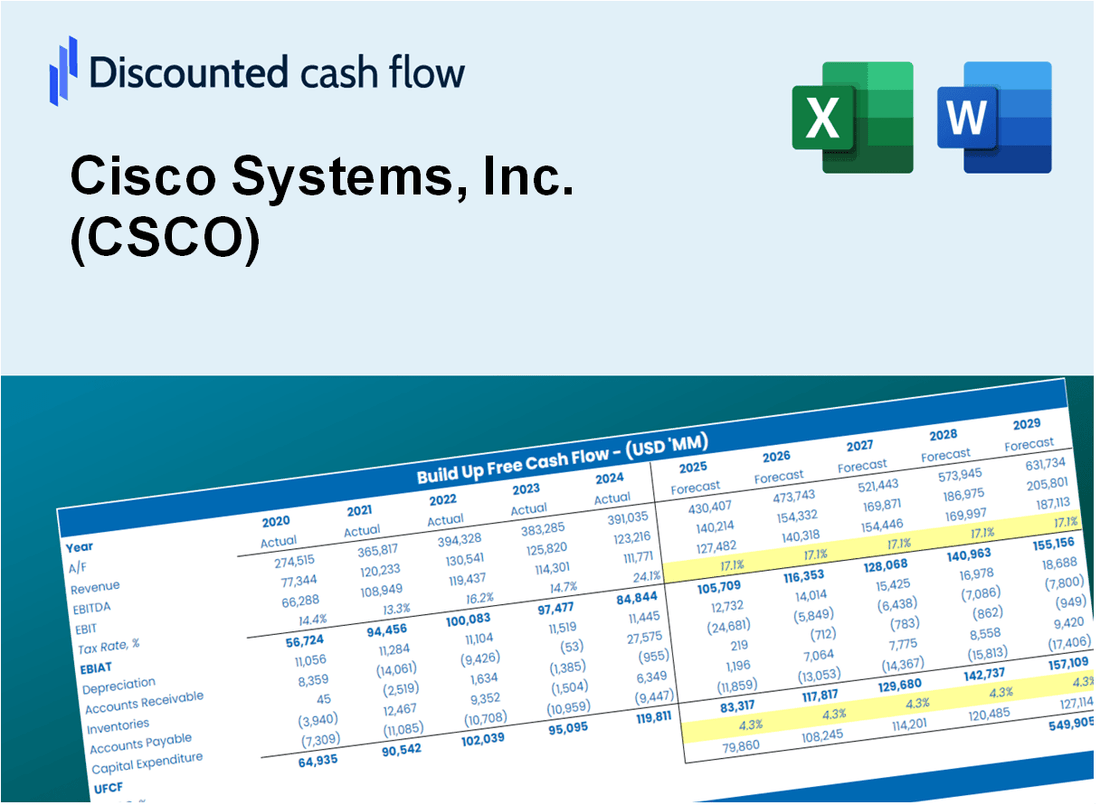
Gain mastery over your Cisco Systems, Inc. (CSCO) valuation analysis with our sophisticated DCF Calculator! Equipped with up-to-date data on (CSCO), this Excel template enables you to adjust forecasts and assumptions to determine the intrinsic value of Cisco Systems, Inc. (CSCO) with accuracy.
What You Will Get
- Editable Excel Template: A fully customizable Excel-based DCF Calculator featuring pre-filled real CSCO financials.
- Real-World Data: Historical data and forward-looking estimates (highlighted in the yellow cells).
- Forecast Flexibility: Adjust forecast assumptions such as revenue growth, EBITDA %, and WACC.
- Automatic Calculations: Instantly observe how your inputs influence Cisco’s valuation.
- Professional Tool: Designed for investors, CFOs, consultants, and financial analysts.
- User-Friendly Design: Organized for clarity and ease of use, complete with step-by-step instructions.
Key Features
- 🔍 Real-Life CSCO Financials: Pre-filled historical and projected data for Cisco Systems, Inc.
- ✏️ Fully Customizable Inputs: Adjust all critical parameters (yellow cells) like WACC, growth %, and tax rates.
- 📊 Professional DCF Valuation: Built-in formulas calculate Cisco’s intrinsic value using the Discounted Cash Flow method.
- ⚡ Instant Results: Visualize Cisco’s valuation instantly after making changes.
- Scenario Analysis: Test and compare outcomes for various financial assumptions side-by-side.
How It Works
- 1. Open the Template: Download and open the Excel file containing Cisco Systems, Inc. (CSCO) preloaded data.
- 2. Edit Assumptions: Modify essential inputs such as revenue growth rates, WACC, and capital expenditures.
- 3. View Results Instantly: The DCF model automatically calculates intrinsic value and NPV for Cisco Systems, Inc. (CSCO).
- 4. Test Scenarios: Evaluate various forecasts to explore different valuation possibilities.
- 5. Use with Confidence: Deliver professional valuation insights to enhance your decision-making process.
Why Choose This Calculator for Cisco Systems, Inc. (CSCO)?
- All-in-One Solution: Combines DCF, WACC, and financial ratio analyses tailored for Cisco.
- Flexible Inputs: Modify yellow-highlighted fields to explore different investment scenarios.
- In-Depth Analysis: Automatically computes Cisco’s intrinsic value and Net Present Value.
- Preloaded Information: Access to historical and forecasted data for accurate evaluations.
- Expert-Level Tool: Perfect for financial analysts, investors, and business consultants focused on Cisco.
Who Should Use This Product?
- Individual Investors: Make informed decisions about buying or selling Cisco Systems stock (CSCO).
- Financial Analysts: Streamline valuation processes with ready-to-use financial models for Cisco (CSCO).
- Consultants: Deliver professional valuation insights on Cisco (CSCO) to clients quickly and accurately.
- Business Owners: Understand how large companies like Cisco (CSCO) are valued to guide your own strategy.
- Finance Students: Learn valuation techniques using real-world data and scenarios related to Cisco (CSCO).
What the Template Contains
- Comprehensive DCF Model: Editable template with detailed valuation calculations tailored for Cisco Systems, Inc. (CSCO).
- Real-World Data: Cisco’s historical and projected financials preloaded for thorough analysis.
- Customizable Parameters: Adjust WACC, growth rates, and tax assumptions to explore various scenarios.
- Financial Statements: Full annual and quarterly breakdowns for enhanced insights into Cisco's performance.
- Key Ratios: Built-in analysis for profitability, efficiency, and leverage specific to Cisco Systems, Inc. (CSCO).
- Dashboard with Visual Outputs: Charts and tables designed for clear, actionable results regarding Cisco's financial health.
Disclaimer
All information, articles, and product details provided on this website are for general informational and educational purposes only. We do not claim any ownership over, nor do we intend to infringe upon, any trademarks, copyrights, logos, brand names, or other intellectual property mentioned or depicted on this site. Such intellectual property remains the property of its respective owners, and any references here are made solely for identification or informational purposes, without implying any affiliation, endorsement, or partnership.
We make no representations or warranties, express or implied, regarding the accuracy, completeness, or suitability of any content or products presented. Nothing on this website should be construed as legal, tax, investment, financial, medical, or other professional advice. In addition, no part of this site—including articles or product references—constitutes a solicitation, recommendation, endorsement, advertisement, or offer to buy or sell any securities, franchises, or other financial instruments, particularly in jurisdictions where such activity would be unlawful.
All content is of a general nature and may not address the specific circumstances of any individual or entity. It is not a substitute for professional advice or services. Any actions you take based on the information provided here are strictly at your own risk. You accept full responsibility for any decisions or outcomes arising from your use of this website and agree to release us from any liability in connection with your use of, or reliance upon, the content or products found herein.