
|
Camping World Holdings, Inc. (CWH) DCF Valuation |
Fully Editable: Tailor To Your Needs In Excel Or Sheets
Professional Design: Trusted, Industry-Standard Templates
Investor-Approved Valuation Models
MAC/PC Compatible, Fully Unlocked
No Expertise Is Needed; Easy To Follow
Camping World Holdings, Inc. (CWH) Bundle
Evaluate Camping World Holdings, Inc.'s financial outlook like an expert! This (CWH) DCF Calculator provides pre-filled financials and offers complete flexibility to modify revenue growth, WACC, margins, and other essential assumptions to align with your predictions.
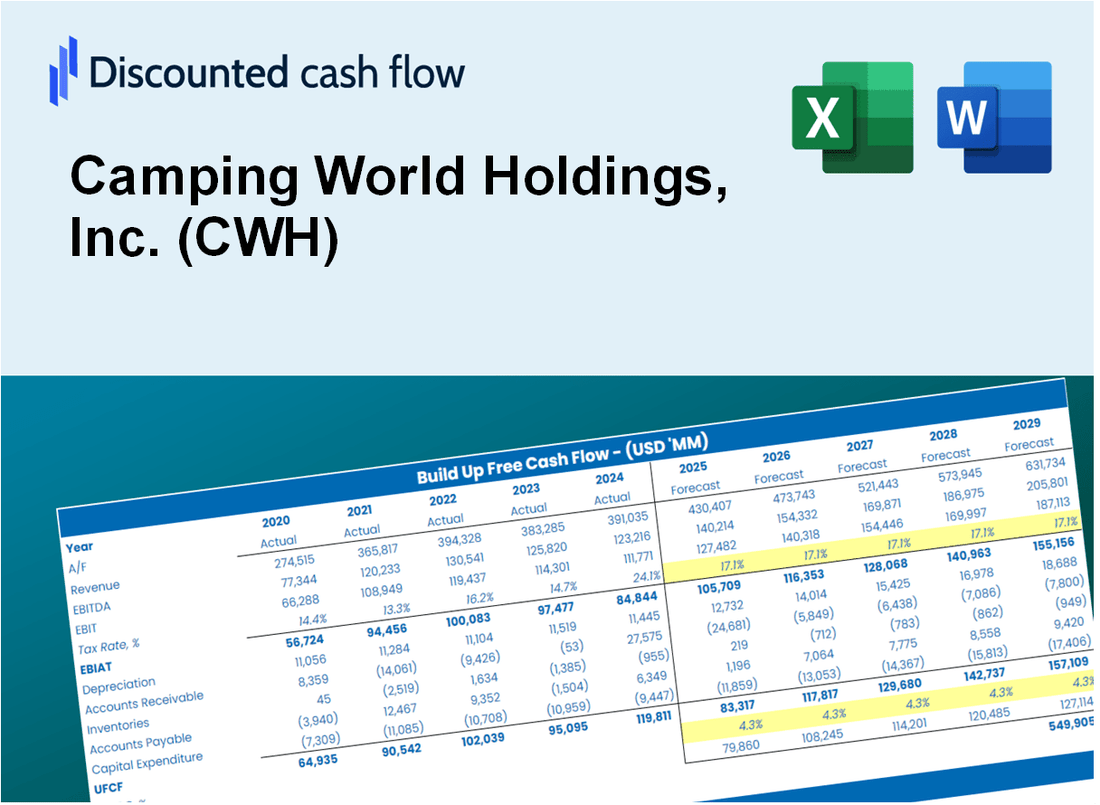
Discounted Cash Flow (DCF) - (USD MM)
| Year | AY1 2020 |
AY2 2021 |
AY3 2022 |
AY4 2023 |
AY5 2024 |
FY1 2025 |
FY2 2026 |
FY3 2027 |
FY4 2028 |
FY5 2029 |
|---|---|---|---|---|---|---|---|---|---|---|
| Revenue | 5,446.6 | 6,913.8 | 6,967.0 | 6,226.5 | 6,100.0 | 6,329.4 | 6,567.5 | 6,814.6 | 7,070.9 | 7,336.9 |
| Revenue Growth, % | 0 | 26.94 | 0.77033 | -10.63 | -2.03 | 3.76 | 3.76 | 3.76 | 3.76 | 3.76 |
| EBITDA | 563.8 | 908.4 | 707.8 | 336.4 | 226.5 | 541.4 | 561.7 | 582.9 | 604.8 | 627.5 |
| EBITDA, % | 10.35 | 13.14 | 10.16 | 5.4 | 3.71 | 8.55 | 8.55 | 8.55 | 8.55 | 8.55 |
| Depreciation | 109.5 | 126.9 | 140.0 | 68.6 | 81.2 | 104.9 | 108.9 | 113.0 | 117.2 | 121.6 |
| Depreciation, % | 2.01 | 1.84 | 2.01 | 1.1 | 1.33 | 1.66 | 1.66 | 1.66 | 1.66 | 1.66 |
| EBIT | 454.2 | 781.5 | 567.9 | 267.7 | 145.3 | 436.4 | 452.8 | 469.9 | 487.6 | 505.9 |
| EBIT, % | 8.34 | 11.3 | 8.15 | 4.3 | 2.38 | 6.9 | 6.9 | 6.9 | 6.9 | 6.9 |
| Total Cash | 166.1 | 267.3 | 130.1 | 39.6 | 208.4 | 162.5 | 168.6 | 175.0 | 181.5 | 188.4 |
| Total Cash, percent | .0 | .0 | .0 | .0 | .0 | .0 | .0 | .0 | .0 | .0 |
| Account Receivables | 131.6 | 159.4 | 162.8 | 188.3 | 181.6 | 165.3 | 171.5 | 178.0 | 184.7 | 191.6 |
| Account Receivables, % | 2.42 | 2.31 | 2.34 | 3.02 | 2.98 | 2.61 | 2.61 | 2.61 | 2.61 | 2.61 |
| Inventories | 1,136.3 | 1,792.9 | 2,123.9 | 2,042.9 | 1,821.8 | 1,771.7 | 1,838.3 | 1,907.5 | 1,979.2 | 2,053.7 |
| Inventories, % | 20.86 | 25.93 | 30.48 | 32.81 | 29.87 | 27.99 | 27.99 | 27.99 | 27.99 | 27.99 |
| Accounts Payable | 148.5 | 136.8 | 127.7 | 133.5 | 145.3 | 140.1 | 145.3 | 150.8 | 156.5 | 162.3 |
| Accounts Payable, % | 2.73 | 1.98 | 1.83 | 2.14 | 2.38 | 2.21 | 2.21 | 2.21 | 2.21 | 2.21 |
| Capital Expenditure | -85.1 | -253.5 | -211.5 | -200.5 | -90.8 | -164.2 | -170.4 | -176.8 | -183.5 | -190.4 |
| Capital Expenditure, % | -1.56 | -3.67 | -3.04 | -3.22 | -1.49 | -2.59 | -2.59 | -2.59 | -2.59 | -2.59 |
| Tax Rate, % | 57.19 | 57.19 | 57.19 | 57.19 | 57.19 | 57.19 | 57.19 | 57.19 | 57.19 | 57.19 |
| EBITAT | 389.0 | 683.4 | 442.9 | 168.3 | 62.2 | 311.4 | 323.1 | 335.2 | 347.8 | 360.9 |
| Depreciation | ||||||||||
| Changes in Account Receivables | ||||||||||
| Changes in Inventories | ||||||||||
| Changes in Accounts Payable | ||||||||||
| Capital Expenditure | ||||||||||
| UFCF | -706.1 | -139.2 | 27.9 | 97.6 | 292.2 | 313.2 | 194.0 | 201.2 | 208.8 | 216.7 |
| WACC, % | 6.85 | 6.95 | 6.44 | 5.63 | 4.57 | 6.09 | 6.09 | 6.09 | 6.09 | 6.09 |
| PV UFCF | ||||||||||
| SUM PV UFCF | 962.2 | |||||||||
| Long Term Growth Rate, % | 0.50 | |||||||||
| Free cash flow (T + 1) | 218 | |||||||||
| Terminal Value | 3,897 | |||||||||
| Present Terminal Value | 2,900 | |||||||||
| Enterprise Value | 3,862 | |||||||||
| Net Debt | 3,434 | |||||||||
| Equity Value | 428 | |||||||||
| Diluted Shares Outstanding, MM | 48 | |||||||||
| Equity Value Per Share | 8.92 |
What You Will Get
- Real Camping World Data: Preloaded financials – from revenue to EBIT – based on actual and projected figures for Camping World Holdings, Inc. (CWH).
- Full Customization: Adjust all critical parameters (yellow cells) like WACC, growth %, and tax rates tailored for CWH.
- Instant Valuation Updates: Automatic recalculations to analyze the impact of changes on Camping World’s fair value.
- Versatile Excel Template: Designed for quick edits, scenario testing, and detailed projections specific to Camping World Holdings, Inc. (CWH).
- Time-Saving and Accurate: Avoid building models from scratch while ensuring precision and flexibility for CWH.
Key Features
- Pre-Loaded Data: Camping World Holdings, Inc.'s (CWH) historical financial statements and pre-filled forecasts.
- Fully Adjustable Inputs: Modify WACC, tax rates, revenue growth, and EBITDA margins as needed.
- Instant Results: View Camping World Holdings, Inc.'s (CWH) intrinsic value recalculated in real time.
- Clear Visual Outputs: Dashboard charts illustrate valuation results and essential metrics.
- Built for Accuracy: A professional tool designed for analysts, investors, and finance professionals.
How It Works
- Download: Get the pre-prepared Excel file containing Camping World Holdings, Inc.'s (CWH) financial data.
- Customize: Modify forecasts, such as revenue growth, EBITDA %, and WACC.
- Update Automatically: The intrinsic value and NPV calculations refresh in real-time.
- Test Scenarios: Generate various projections and compare results instantly.
- Make Decisions: Utilize the valuation outcomes to inform your investment strategy.
Why Choose This Calculator for Camping World Holdings, Inc. (CWH)?
- All-in-One Solution: Combines DCF, WACC, and financial ratio analyses tailored for the camping industry.
- Adjustable Parameters: Modify the highlighted cells to explore different investment scenarios.
- In-Depth Analysis: Automatically computes Camping World’s intrinsic value and Net Present Value.
- Preloaded Information: Access historical and projected data for reliable analysis.
- Expert-Level Tool: Perfect for financial analysts, investors, and outdoor business consultants.
Who Should Use Camping World Holdings, Inc. (CWH)?
- Outdoor Enthusiasts: Enhance your camping experience with top-quality gear and services.
- RV Owners: Access expert advice and resources for maintaining and upgrading your recreational vehicle.
- Travel Planners: Utilize our extensive inventory to create memorable outdoor adventures for clients.
- Families: Discover family-friendly camping solutions that cater to all ages and preferences.
- Educators and Students: Explore hands-on learning opportunities related to outdoor recreation and environmental stewardship.
What the Template Contains
- Preloaded CWH Data: Historical and projected financial data, including revenue, EBIT, and capital expenditures.
- DCF and WACC Models: Professional-grade sheets for calculating intrinsic value and Weighted Average Cost of Capital.
- Editable Inputs: Yellow-highlighted cells for adjusting revenue growth, tax rates, and discount rates.
- Financial Statements: Comprehensive annual and quarterly financials for deeper analysis.
- Key Ratios: Profitability, leverage, and efficiency ratios to evaluate performance.
- Dashboard and Charts: Visual summaries of valuation outcomes and assumptions.
Disclaimer
All information, articles, and product details provided on this website are for general informational and educational purposes only. We do not claim any ownership over, nor do we intend to infringe upon, any trademarks, copyrights, logos, brand names, or other intellectual property mentioned or depicted on this site. Such intellectual property remains the property of its respective owners, and any references here are made solely for identification or informational purposes, without implying any affiliation, endorsement, or partnership.
We make no representations or warranties, express or implied, regarding the accuracy, completeness, or suitability of any content or products presented. Nothing on this website should be construed as legal, tax, investment, financial, medical, or other professional advice. In addition, no part of this site—including articles or product references—constitutes a solicitation, recommendation, endorsement, advertisement, or offer to buy or sell any securities, franchises, or other financial instruments, particularly in jurisdictions where such activity would be unlawful.
All content is of a general nature and may not address the specific circumstances of any individual or entity. It is not a substitute for professional advice or services. Any actions you take based on the information provided here are strictly at your own risk. You accept full responsibility for any decisions or outcomes arising from your use of this website and agree to release us from any liability in connection with your use of, or reliance upon, the content or products found herein.