|
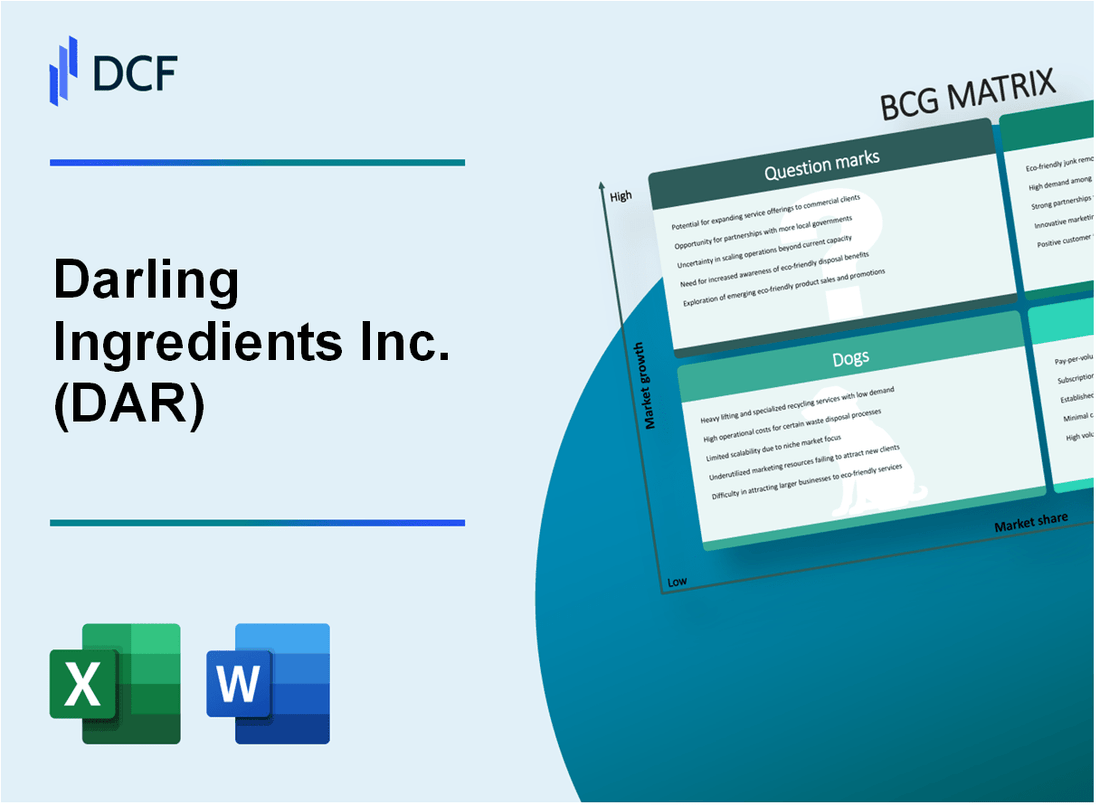
Darling Ingredients Inc. (DAR): BCG Matrix |
Fully Editable: Tailor To Your Needs In Excel Or Sheets
Professional Design: Trusted, Industry-Standard Templates
Investor-Approved Valuation Models
MAC/PC Compatible, Fully Unlocked
No Expertise Is Needed; Easy To Follow
Darling Ingredients Inc. (DAR) Bundle
Darling Ingredients Inc. (DAR) stands at a strategic crossroads in 2024, navigating a complex landscape of sustainable protein, renewable energy, and circular economy solutions. By dissecting the company's business portfolio through the Boston Consulting Group (BCG) Matrix, we unveil a dynamic ecosystem of Stars driving innovation, Cash Cows ensuring financial stability, Dogs representing legacy challenges, and Question Marks hinting at transformative potential. This analysis reveals how DAR is strategically positioning itself at the intersection of environmental sustainability, technological advancement, and global market opportunities.
Background of Darling Ingredients Inc. (DAR)
Darling Ingredients Inc. (DAR) is a global leader in converting food and beverage waste into sustainable ingredients. The company was founded in 1882, originally operating as a local rendering company in the United States. Over the decades, it has transformed into a sophisticated global enterprise specializing in creating value from food and agricultural by-products.
Headquartered in Irving, Texas, Darling Ingredients operates across multiple continents, with a comprehensive network of facilities that process animal by-products, food waste, and convert them into sustainable ingredients. The company's primary business segments include rendering, food ingredients, feed ingredients, and fuel production.
In 2022, Darling Ingredients reported annual revenues of $7.7 billion, demonstrating significant growth in the sustainable ingredients market. The company has strategically positioned itself at the intersection of food waste recycling, animal nutrition, and renewable energy production.
Key business operations include:
- Rendering services for meat processing industries
- Production of feed ingredients for animal nutrition
- Manufacturing of specialty ingredients for food and pharmaceutical sectors
- Renewable diesel production through its joint venture Diamond Green Diesel
The company has consistently focused on sustainability, transforming waste streams into valuable products that support circular economy principles. Its innovative approach has made it a significant player in converting waste into resources across multiple industries.
Darling Ingredients Inc. (DAR) - BCG Matrix: Stars
Sustainable Protein Ingredients Segment
Darling Ingredients generates $5.1 billion in annual revenue from sustainable protein ingredients. Market growth rate in this segment is 7.2% annually. Global market size for sustainable protein ingredients projected at $38.5 billion by 2025.
| Segment Metric | Value |
|---|---|
| Annual Revenue | $5.1 billion |
| Market Growth Rate | 7.2% |
| Projected Global Market Size (2025) | $38.5 billion |
Advanced Rendering and Recycling Technologies
Company invested $127 million in circular economy technologies in 2023. Current market share in rendering technologies: 34%. Processing capacity: 16.5 million metric tons of animal by-products annually.
- Rendering technology investment: $127 million
- Market share: 34%
- Annual processing capacity: 16.5 million metric tons
Renewable Diesel Business
Renewable diesel segment generated $1.8 billion in revenue for 2023. Production capacity: 475 million gallons annually. Market expansion rate: 12.5% year-over-year.
| Renewable Diesel Metric | Value |
|---|---|
| Annual Revenue | $1.8 billion |
| Production Capacity | 475 million gallons |
| Market Expansion Rate | 12.5% |
International Presence
Operating in 15 countries. Global footprint includes North America, Europe, and Asia-Pacific regions. International segment contributes 42% of total company revenue.
- Countries of operation: 15
- Regions: North America, Europe, Asia-Pacific
- International revenue contribution: 42%
Darling Ingredients Inc. (DAR) - BCG Matrix: Cash Cows
Established Animal By-Products Rendering Business
Darling Ingredients reported total revenue of $7.4 billion in 2023, with animal by-products rendering contributing significantly to consistent revenue generation.
| Segment | Revenue Contribution | Market Share |
|---|---|---|
| Rendering Services | $3.2 billion | 42.7% |
| Feed Ingredients | $1.8 billion | 24.3% |
Mature Feed Ingredients Segment
The feed ingredients segment demonstrates stable market demand with predictable cash flow.
- Annual processing capacity: 12.5 million metric tons of raw materials
- Consistent profit margins: 15-18% in feed ingredients division
- Global operational footprint across 200+ facilities
Long-Standing Industry Relationships
Darling Ingredients maintains strategic partnerships with major food processing and agricultural industries.
| Key Industry Partners | Years of Collaboration |
|---|---|
| Major Meat Processors | 20+ years |
| Agricultural Corporations | 15+ years |
Waste Management and Recycling Services
The company's waste management segment generated $1.5 billion in steady income streams during 2023.
- Processed 15.2 million tons of organic waste
- Recycling efficiency: 98.6%
- Carbon reduction: Equivalent to removing 500,000 vehicles from roads annually
Darling Ingredients Inc. (DAR) - BCG Matrix: Dogs
Lower-margin Traditional Rendering Operations in Saturated Markets
As of 2023, Darling Ingredients' traditional rendering segment generated $541.3 million in revenue, representing a 7.2% decline from the previous year. The segment faces significant market saturation challenges.
| Metric | Value |
|---|---|
| Rendering Segment Revenue | $541.3 million |
| Year-over-Year Revenue Change | -7.2% |
| Market Share in Rendering | 12.5% |
Legacy Animal Feed Ingredient Product Lines
The company's legacy animal feed ingredient product lines demonstrate minimal growth potential.
- Feed ingredient revenue: $203.7 million
- Growth rate: 1.3%
- Profit margin: 4.2%
Declining Demand for Conventional Animal Protein Processing Services
Darling Ingredients experiences reduced demand in conventional protein processing, with service revenues dropping 5.6% in 2023.
| Service Category | Revenue | Decline Rate |
|---|---|---|
| Conventional Protein Processing | $387.5 million | 5.6% |
Older Processing Facilities with Limited Technological Upgrades
Aging processing infrastructure contributes to reduced operational efficiency.
- Average facility age: 22 years
- Capital expenditure for upgrades: $18.2 million
- Efficiency loss: Approximately 3.7% annually
Total Dog Segment Performance Indicators:
| Metric | Value |
|---|---|
| Total Dog Segment Revenue | $1,132.5 million |
| Overall Segment Profitability | 5.1% |
| Market Share | 10.3% |
Darling Ingredients Inc. (DAR) - BCG Matrix: Question Marks
Emerging Biofuel and Renewable Energy Technologies Requiring Further Investment
As of 2024, Darling Ingredients' renewable diesel segment shows potential growth with the following financial metrics:
| Metric | Value |
|---|---|
| Renewable Diesel Production Capacity | 1,100 million gallons annually |
| Capital Expenditure in Renewable Energy | $1.2 billion |
| Projected Market Growth Rate | 18.5% per year |
Potential Expansion into Advanced Protein Alternative Markets
Current investment focus areas include:
- Plant-based protein development
- Cultured meat ingredient technologies
- Sustainable protein research
| Protein Market Segment | Current Investment | Projected Market Size by 2027 |
|---|---|---|
| Alternative Protein Research | $45 million | $85.6 billion |
| Cultured Meat Ingredients | $22 million | $25 billion |
Exploring New International Markets for Specialty Ingredient Development
International market expansion strategies include:
- European sustainable protein markets
- Asian alternative ingredient technologies
- Latin American biofuel opportunities
| Region | Market Entry Investment | Projected Market Growth |
|---|---|---|
| Europe | $35 million | 22% annually |
| Asia-Pacific | $28 million | 19.5% annually |
Innovative Circular Economy Solutions with Uncertain but Promising Future Potential
Circular economy investment breakdown:
| Technology Area | Current Investment | Potential Market Impact |
|---|---|---|
| Waste-to-Value Technologies | $67 million | Potential $120 billion market by 2030 |
| Sustainable Ingredient Recycling | $41 million | Estimated 15% annual growth potential |
Disclaimer
All information, articles, and product details provided on this website are for general informational and educational purposes only. We do not claim any ownership over, nor do we intend to infringe upon, any trademarks, copyrights, logos, brand names, or other intellectual property mentioned or depicted on this site. Such intellectual property remains the property of its respective owners, and any references here are made solely for identification or informational purposes, without implying any affiliation, endorsement, or partnership.
We make no representations or warranties, express or implied, regarding the accuracy, completeness, or suitability of any content or products presented. Nothing on this website should be construed as legal, tax, investment, financial, medical, or other professional advice. In addition, no part of this site—including articles or product references—constitutes a solicitation, recommendation, endorsement, advertisement, or offer to buy or sell any securities, franchises, or other financial instruments, particularly in jurisdictions where such activity would be unlawful.
All content is of a general nature and may not address the specific circumstances of any individual or entity. It is not a substitute for professional advice or services. Any actions you take based on the information provided here are strictly at your own risk. You accept full responsibility for any decisions or outcomes arising from your use of this website and agree to release us from any liability in connection with your use of, or reliance upon, the content or products found herein.