
|
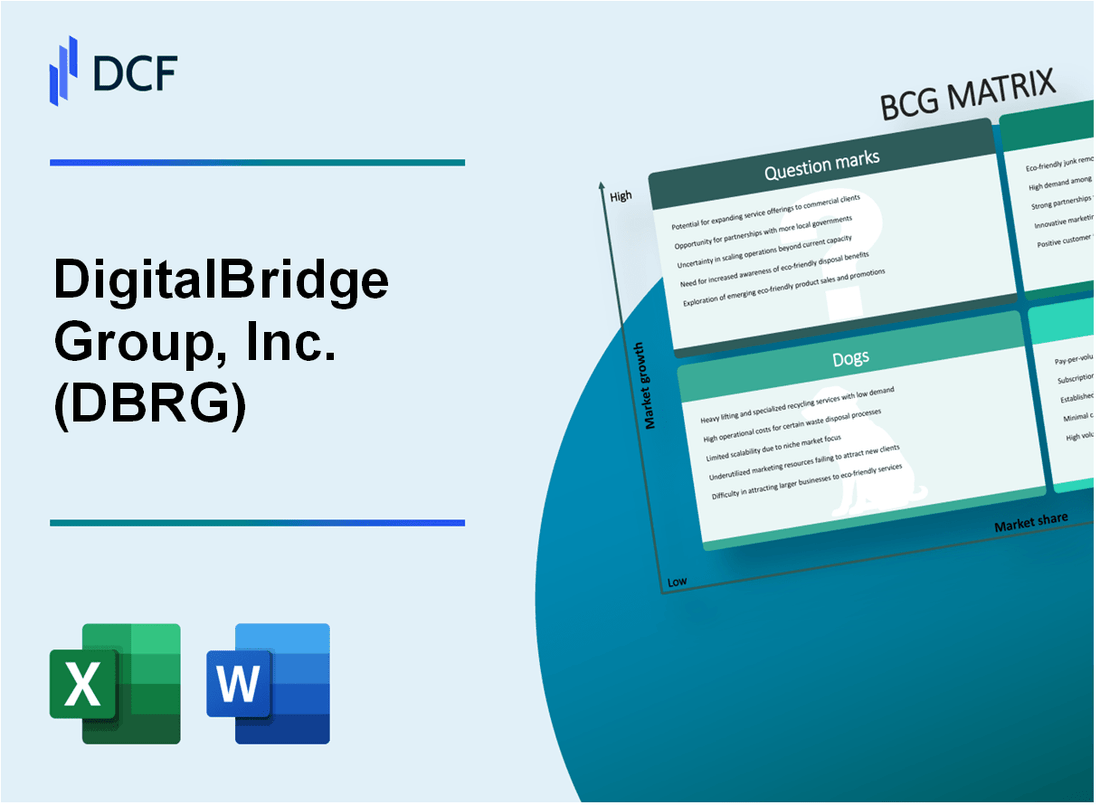
DigitalBridge Group, Inc. (DBRG): BCG Matrix [Dec-2025 Updated] |
Fully Editable: Tailor To Your Needs In Excel Or Sheets
Professional Design: Trusted, Industry-Standard Templates
Investor-Approved Valuation Models
MAC/PC Compatible, Fully Unlocked
No Expertise Is Needed; Easy To Follow
DigitalBridge Group, Inc. (DBRG) Bundle
You're looking at DigitalBridge Group, Inc. as a pure-play digital infrastructure asset manager, and mapping its portfolio using the BCG Matrix shows a clear strategic split as of late 2025. We see massive growth in Stars like hyperscale data centers fueled by AI leasing and the $11.7 billion DBP III fund, while core assets like 500,000+ cell tower sites continue to print stable Cash Cow revenue, which hit $93.5 million in Q3. Still, the firm is actively shedding Dogs-legacy assets-to focus capital on high-potential Question Marks like Edge infrastructure and new stabilized strategies that need to scale up from their current lower market share; dive in to see exactly where your focus should be.
Background of DigitalBridge Group, Inc. (DBRG)
DigitalBridge Group, Inc. (DBRG) is a leading global alternative asset manager. You should know that their entire focus is on investing in digital infrastructure, which is the backbone of the modern internet. This includes assets like cell towers, data centers, fiber networks, small cells, and edge infrastructure facilities.
As of late 2025, specifically looking at the third quarter results, DigitalBridge Group, Inc. was managing a substantial $108 billion of infrastructure assets on behalf of its limited partners and shareholders. The core metric for their asset management platform, Fee-Earning Equity Under Management (FEEUM), hit $40.7 billion in Q3 2025. Honestly, that was a big deal because they achieved their full-year target of growing FEEUM to over $40 billion one quarter early.
When we look at the engine of their business-the fee revenue-the story is strong growth. For the third quarter of 2025, Fee Revenue was $93.5 million, which was a solid 22% increase year-over-year. This consistent fee growth is what drives their Fee-Related Earnings (FRE), which jumped 43% year-over-year to $37.3 million in that same quarter, pushing the FRE margin up to 40%. That's the operational health you want to see from an asset manager.
Now, you'll see wildly different numbers if you look at total revenue, and that's because of how asset managers book carried interest and principal income. For instance, the total revenue for Q3 2025 was reported at $93.3 million, but the Trailing Twelve Months revenue ending September 30, 2025, was only $100.35M, representing a massive -88.66% drop year-over-year. Don't let that scare you; it's an accounting artifact tied to fund valuations, not a collapse of the core business. For context, the full fiscal year 2024 revenue was $607.0M, down -26.1% from 2023.
The strategic deployment plan for 2025 is aggressive, showing management's confidence in the market. DigitalBridge Group, Inc. planned to deploy $18 billion across the year, heavily targeting hyper-scale data centers, edge computing, and fiber networks to capitalize on the AI adoption trend. This focus is backed by real scale; across their data center portfolio, they have secured 20.9 GW of power capacity.
DigitalBridge Group, Inc. (DBRG) - BCG Matrix: Stars
You're looking at the core growth engines for DigitalBridge Group, Inc. (DBRG) right now, the assets that command high market share in rapidly expanding sectors. These are the businesses where DigitalBridge Group, Inc. must deploy significant capital to maintain leadership, so you need to know the scale of the investment and the returns they are generating.
The AI-enabling infrastructure segment is clearly a Star, evidenced by the massive capital formation around its flagship fund. DigitalBridge Partners III (DBP III) closed with total capital formation of $11.7 billion as of November 2025. This figure is composed of over $7.2 billion in fund commitments and an additional $4.5 billion in fund LP co-investment commitments secured across the DBP III portfolio.
This capital deployment is directly fueling growth in Fee-Earning Equity Under Management (FEEUM). As of the third quarter of 2025, FEEUM reached $40.7 billion, marking a 19% year-over-year increase, which equates to a growth of $6.6 billion. This growth is directly tied to the demand for AI-enabling infrastructure.
The Hyperscale Data Centers portfolio, which includes Vantage Data Centers, is demonstrating this demand through record leasing activity. The portfolio achieved a record 2.6 GW leased across its assets during the third quarter of 2025. This capacity is being built out to support global hyperscale customers and AI workloads, such as the $25 billion, 1.4GW Frontier campus announced for Vantage.
To address the power constraints that limit data center growth, DigitalBridge Group, Inc. is also investing in new energy platforms. Takanock, LLC, a provider of digital and power infrastructure solutions, secured new capital commitments totaling $500 million from ArcLight and DigitalBridge Group, Inc. as of June 25, 2025.
Here's a quick look at the key metrics defining these Star assets:
| Metric | Value/Amount | Date/Period |
| DBP III Total Capital Formation | $11.7 billion | November 2025 |
| DBP III Fund Commitments | Over $7.2 billion | November 2025 |
| DBP III LP Co-Investment Commitments | Additional $4.5 billion | November 2025 |
| Fee-Earning Equity Under Management (FEEUM) | $40.7 billion | Q3 2025 |
| FEEUM Year-over-Year Growth | 19% | Q3 2025 |
| Data Center Leasing (Portfolio) | Record 2.6 GW | Q3 2025 |
| Takanock Capital Commitment | $500 million | June 2025 |
These Stars consume significant cash to maintain their high growth trajectory, which is why the scale of the DBP III fund is so critical. The strategy here is to invest heavily now to secure market leadership, positioning these assets to become Cash Cows when the high-growth market eventually matures.
The operational highlights supporting the Star categorization include:
- Hyperscale Data Centers leasing activity reached 2.6 GW in Q3 2025.
- FEEUM growth of $6.6 billion year-over-year to reach $40.7 billion.
- DBP III fund commitments include over $7.2 billion in fund commitments.
- Digital Energy platform Takanock secured a $500 million commitment.
- Fee-related earnings (FRE) grew 43% year-over-year to $37.3 million in Q3 2025.
Finance: draft the Q4 2025 capital deployment forecast based on DBP III closing by Friday.
DigitalBridge Group, Inc. (DBRG) - BCG Matrix: Cash Cows
You're analyzing the core, stable businesses within DigitalBridge Group, Inc. (DBRG) portfolio-the ones that generate more cash than they consume, funding the rest of the firm's strategy. These Cash Cows operate in mature segments where DigitalBridge Group, Inc. has already established a high market share, meaning promotion and placement investments are relatively low, letting the cash flow build up.
The stability comes from the long-term nature of the underlying digital infrastructure assets. These units provide the necessary capital to service corporate debt, fund growth in the riskier Question Mark areas, and, importantly, pay dividends to shareholders. The focus here is on maintaining efficiency and milking the gains passively.
Here's a look at the key components fitting this Cash Cow profile for DigitalBridge Group, Inc. as of 2025, based on recent operational and financial reports:
- Macro Cell Towers, exemplified by Vertical Bridge, represent a bedrock of stable, recurring revenue.
- Core Long-Haul Fiber Networks, like Zayo, offer essential, high-capacity transport services.
- The Fee Revenue stream is the direct measure of the management business's cash generation engine.
- Overall Assets Under Management (AUM) provide the scale that underpins the management fees.
The financial performance in the third quarter of 2025 clearly demonstrates this cash-generating power. Fee Revenue hit \$93.5 million in Q3 2025, marking a 22% increase year-over-year. This directly translated into Fee Related Earnings (FRE) of \$37.3 million for the quarter, achieving a strong 40% margin and growing 43% year-over-year. Distributable Earnings (DE), which DigitalBridge Group, Inc. calculates after preferred stock dividends and interest expenses, more than doubled, showing a 102% increase to \$21.7 million.
The scale of the underlying assets supports these figures, positioning them as classic Cash Cows:
| Asset Class / Metric | Value / Status | Context / Source Data |
|---|---|---|
| Infrastructure Assets Under Management (AUM) | \$108 billion | Overall assets managed on behalf of limited partners and shareholders. |
| Fee Earning Equity Under Management (FEEUM) | \$40.7 billion | Up 19% year-over-year; DigitalBridge Group, Inc. achieved its full-year target one quarter early. |
| Macro Cell Tower Sites (Vertical Bridge) | Over 500,000 sites | Owned or master lease sites, providing stable, recurring revenue. |
| Core Long-Haul Fiber Route Miles (Zayo) | 237,000+ route miles | Figure reflecting scale after the Crown Castle fiber acquisition, as per the scenario outline. |
The fiber network component, specifically Zayo, is being actively supported to maintain its market leadership, which solidifies its Cash Cow status. Following the acquisition of Crown Castle's fiber business, Zayo added 90,000 route miles, boosting its scale by more than 50% in North America. The company expects its network to be fully 400G enabled by the end of 2025. Investments here are aimed at efficiency, such as modernizing back office systems, rather than massive market share battles.
The management fee stream is the direct result of this asset base maturity. The consistent Fee Revenue of \$93.5 million in Q3 2025 provides the necessary cash to cover corporate overhead, which is a key function of a Cash Cow. For instance, the quarterly preferred dividends, which shareholders rely on, cost \$14.6 million per quarter, a figure comfortably covered by the \$37.3 million in FRE generated. Furthermore, DigitalBridge Group, Inc. ended Q3 with \$173 million in available corporate cash, giving it significant flexibility.
These assets are the engine room. They are mature, market-leading, and generate excess cash flow. The strategy is to invest just enough to maintain that productivity and extract the maximum distributable earnings.
DigitalBridge Group, Inc. (DBRG) - BCG Matrix: Dogs
The Dogs quadrant for DigitalBridge Group, Inc. (DBRG) is characterized by the remaining elements of the prior diversified structure and the corporate overhead that has not yet been fully streamlined to match the pure-play asset manager profile. These are the areas that require capital or management attention but offer minimal growth or act as a drag on overall distributable earnings.
Legacy Balance Sheet Assets represent the non-core holdings being actively monetized to complete the transition. These legacy non-digital investments are not substantially available for immediate sale and are expected to be monetized over an extended period beyond the near term. While the core Fee Revenue grew robustly, reaching $93.5 million in the third quarter of 2025, up 22% year-over-year, the legacy components contribute to volatility and require ongoing management without the high-growth profile of the core digital infrastructure funds.
Non-digital or non-strategic assets remaining from the prior structure are those that require minimal new capital but offer low growth. These activities, which were previously presented in the Digital Other and Other segments, are now largely subsumed into the corporate structure, reflecting management's focus shift. The challenge here is that while the core business is scaling, these residual assets tie up balance sheet capacity and management focus that could otherwise be deployed to high-growth Stars or Question Marks.
The high corporate operating cost base acts as a significant drag, entrenching net losses in distributable earnings despite strong fee growth. For instance, in the second quarter of 2025, the company reported Operating Expenses of -138.9m USD. This overhead contributed to Distributable Earnings being negative $18.6 million, or a $0.10 loss per share, in the second quarter of 2025. This negative distributable earnings figure stands in contrast to the positive GAAP net income attributable to common stockholders of $17 million for the same period, highlighting how the non-cash, non-distributable items (like volatile carried interest accounting) mask the cash-flow impact of the operating structure.
You're looking at a situation where the core engine is firing on all cylinders, but the legacy chassis is heavy. Here's a quick look at the financial weight these 'Dog' elements represent based on 2025 figures:
| Metric | Period | Value (USD) | Context |
|---|---|---|---|
| Operating Expenses | Q2 2025 | -138.9 million | Reported operating expense amount. |
| Distributable Earnings (DE) | Q2 2025 | -$18.6 million | Represents the cash earnings drag. |
| DE Per Share | Q2 2025 | $(0.10) loss | The per-share impact of the negative distributable earnings. |
| Total Revenue (GAAP) | Q2 2025 | -$3.21 million | Materially impacted by non-core accounting adjustments. |
| Fee Revenue (Core) | Q3 2025 | $93.5 million | The core business metric showing high growth, contrasting the Dog segment. |
These Dog components are candidates for divestiture or aggressive cost reduction because expensive turn-around plans rarely work when the market itself is low-growth. The strategy is to minimize exposure to these units.
- Legacy assets require monetization over an extended period.
- Corporate operating costs have historically entrenched net losses in distributable earnings.
- Non-strategic assets offer low growth and are not substantially available for immediate sale.
- The negative Distributable Earnings in Q2 2025 illustrate the cash consumption/drag.
To be fair, the company's focus on digital infrastructure is the primary driver for its Stars and Cash Cows, but the Dog elements are the reason why the overall corporate structure still faces scrutiny regarding its cost base relative to cash returns. Finance: draft a sensitivity analysis on the impact of a 10% reduction in Q2 2025 Operating Expenses on the Q2 2025 Distributable Earnings by next Tuesday.
DigitalBridge Group, Inc. (DBRG) - BCG Matrix: Question Marks
You're looking at the areas within DigitalBridge Group, Inc. (DBRG) that are in high-growth markets but currently hold a low market share, consuming cash while building future potential. These are the units that require significant investment to move toward Star status or risk becoming Dogs.
Small Cells and Edge Infrastructure
These segments are positioned in markets expected to see massive densification driven by 5G and AI from 2026-2029. While DigitalBridge Group, Inc. has deep expertise across these verticals, specific market share figures for these sub-segments as of late 2025 are not broken out separately from the broader digital infrastructure AUM of $108 billion managed for limited partners and shareholders as of Q3 2025. Data from 2023 indicated that edge computing investments totaled $287 million, representing a market share of 3.6% in the global edge computing infrastructure segment then. The firm notes having surplus and overflow capacity across fiber, small cells, and edge infrastructure, indicating significant underlying assets ready for deployment.
- Edge Computing Investment (2023): $287 million
- Edge Computing Market Share (2023): 3.6%
- Projected Edge Growth Potential (2023 basis): 42% year-over-year
New Stabilized Data Center Strategies
This is a recent launch designed to attract institutional capital by acquiring stabilized assets, needing time to prove market share and scale. Management estimated that approximately $90 billion of 'stranded assets' exist on the stabilized side of the market that this strategy targets. The strategy was actively being launched in 2025, with initial commitments and structure development underway following the Q2 2025 period.
| Metric | Value |
| Estimated Stabilized Asset Pool | $90 billion |
| Q2 2025 Seed Investment for New Initiatives | $32.7 million |
| Expected Carried-Interest Realizations (from maturing assets) | Meaningful over 2026-2028 |
Private Wealth Distribution Channel Partnership with Franklin Templeton
This new initiative, announced in September 2025, aims to democratize access to infrastructure for private wealth clients. DigitalBridge Group, Inc. is one of three managers partnering with Franklin Templeton, which manages $1.64 trillion in assets as of August 31, 2025. DigitalBridge itself manages $106 billion in assets, as noted at the time of the partnership announcement. This channel is intended to deploy capital across DigitalBridge's existing deal flow, which has seen capacity above its current investor base.
Early-stage Platform Investments within DBP III
The firm closed its third value-added digital infrastructure fund, DigitalBridge Partners III (DBP III), with total capital formation reaching $11.7 billion, comprising over $7.2 billion in fund commitments and $4.5 billion in LP co-investment commitments. This capital is being deployed into next-generation platforms where growth potential was identified ahead of the market. These early-stage platforms, by definition of being newly funded by DBP III, have not yet scaled to establish clear market leadership, fitting the Question Mark profile.
The total capital formation for the DBP III strategy is detailed below:
| DBP III Capital Component | Amount |
| Total Fund Commitments | Over $7.2 billion |
| Fund LP Co-Investment Commitments | $4.5 billion |
| Total Capital Formation for DBP III Strategy | $11.7 billion |
The overall Fee-Earning Equity Under Management (FEEUM) stood at $39.7 billion as of June 30, 2025, with an aim to exceed $40 billion in 2025.
Disclaimer
All information, articles, and product details provided on this website are for general informational and educational purposes only. We do not claim any ownership over, nor do we intend to infringe upon, any trademarks, copyrights, logos, brand names, or other intellectual property mentioned or depicted on this site. Such intellectual property remains the property of its respective owners, and any references here are made solely for identification or informational purposes, without implying any affiliation, endorsement, or partnership.
We make no representations or warranties, express or implied, regarding the accuracy, completeness, or suitability of any content or products presented. Nothing on this website should be construed as legal, tax, investment, financial, medical, or other professional advice. In addition, no part of this site—including articles or product references—constitutes a solicitation, recommendation, endorsement, advertisement, or offer to buy or sell any securities, franchises, or other financial instruments, particularly in jurisdictions where such activity would be unlawful.
All content is of a general nature and may not address the specific circumstances of any individual or entity. It is not a substitute for professional advice or services. Any actions you take based on the information provided here are strictly at your own risk. You accept full responsibility for any decisions or outcomes arising from your use of this website and agree to release us from any liability in connection with your use of, or reliance upon, the content or products found herein.