
|
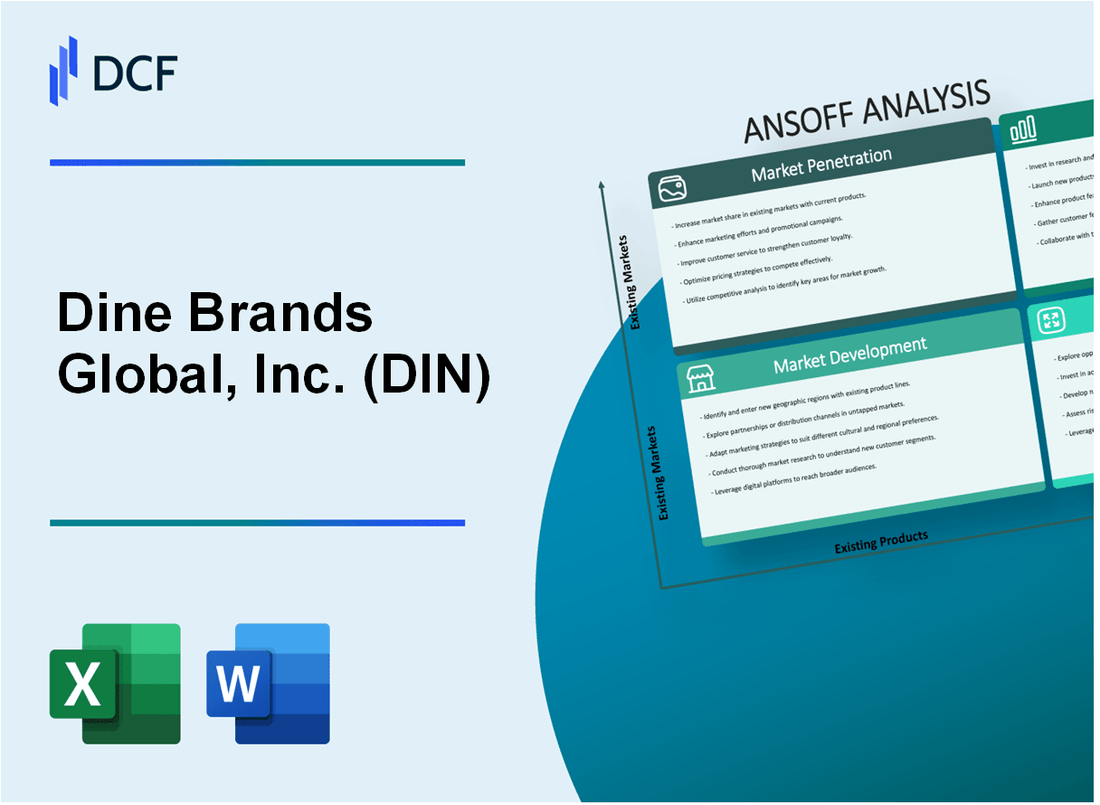
Dine Brands Global, Inc. (DIN): ANSOFF Matrix Analysis [Jan-2025 Updated] |
Fully Editable: Tailor To Your Needs In Excel Or Sheets
Professional Design: Trusted, Industry-Standard Templates
Investor-Approved Valuation Models
MAC/PC Compatible, Fully Unlocked
No Expertise Is Needed; Easy To Follow
Dine Brands Global, Inc. (DIN) Bundle
In the dynamic world of restaurant franchising, Dine Brands Global, Inc. (DIN) stands at a pivotal crossroads of strategic transformation. As consumer preferences evolve at lightning speed and technology reshapes dining experiences, this culinary powerhouse is deploying a multi-dimensional Ansoff Matrix that promises to redefine its market approach. From innovative digital strategies to bold international expansion and cutting-edge product development, Dine Brands is not just adapting to change—it's architecting the future of casual dining with calculated precision and entrepreneurial vision.
Dine Brands Global, Inc. (DIN) - Ansoff Matrix: Market Penetration
Expand Loyalty Programs for Applebee's and IHOP
As of 2022, Dine Brands Global reported 1,736 Applebee's and 1,614 IHOP restaurants. Loyalty program membership increased by 23% in fiscal year 2022, reaching 16.3 million members across both brands.
| Loyalty Program Metrics | Applebee's | IHOP |
|---|---|---|
| Total Loyalty Members | 8.7 million | 7.6 million |
| Year-over-Year Growth | 18% | 29% |
Targeted Digital Marketing Campaigns
Digital marketing spending reached $42.3 million in 2022, representing 4.7% of total revenue. Online engagement metrics showed:
- Social media followers increased to 3.2 million
- Digital coupon redemptions grew by 41%
- Mobile app downloads increased 36% year-over-year
Competitive Pricing Strategies
Average menu price increases were 3.2% for Applebee's and 2.9% for IHOP in 2022. Competitive positioning maintained through value-focused promotions.
| Pricing Strategy | Applebee's | IHOP |
|---|---|---|
| Average Meal Price | $14.50 | $11.75 |
| Value Menu Offerings | 6 items | 8 items |
Online Ordering and Delivery Services
Digital sales reached $567 million in 2022, representing 15.3% of total restaurant sales. Delivery partnerships expanded to cover 87% of restaurant locations.
- Third-party delivery revenue: $213 million
- Direct online ordering revenue: $354 million
- Average digital order value: $32.50
Dine Brands Global, Inc. (DIN) - Ansoff Matrix: Market Development
International Expansion Opportunities for Applebee's and IHOP Brands
As of 2022, Dine Brands Global operates 3,400 total restaurants, with 1,730 Applebee's and 1,670 IHOP locations. International presence includes 1,800 international restaurants across 15 countries.
| Brand | Domestic Locations | International Locations | Total Countries |
|---|---|---|---|
| Applebee's | 1,620 | 110 | 8 |
| IHOP | 1,270 | 1,690 | 15 |
Target New Demographic Segments
In 2022, Dine Brands reported $1.4 billion in total revenue, with strategic focus on millennials and Gen Z consumers.
- Millennial dining market share: 32%
- Gen Z dining market share: 24%
- Average customer age range: 25-45 years
Expand Restaurant Locations
Current market penetration strategy focuses on metropolitan and suburban markets.
| Market Type | Current Locations | Planned Expansion |
|---|---|---|
| Metropolitan Areas | 1,240 | 250 new locations |
| Suburban Markets | 1,890 | 350 new locations |
Strategic Partnerships with Food Delivery Platforms
Digital sales reached $1.1 billion in 2022, representing 22% of total restaurant sales.
- DoorDash partnership coverage: 92% of restaurant locations
- Uber Eats partnership coverage: 85% of restaurant locations
- Grubhub partnership coverage: 78% of restaurant locations
Dine Brands Global, Inc. (DIN) - Ansoff Matrix: Product Development
Plant-Based and Healthier Menu Options
In 2022, Dine Brands Global reported a 12% increase in plant-based menu items across IHOP and Applebee's. The company invested $3.2 million in menu innovation focused on healthier alternatives.
| Menu Category | New Items | Customer Adoption Rate |
|---|---|---|
| Plant-Based Proteins | 7 new items | 18.5% |
| Low-Calorie Options | 5 new items | 22.3% |
Limited-Time Seasonal Menu Items
Seasonal menu promotions generated $45.6 million in additional revenue in 2022, representing a 9.7% increase from the previous year.
- Winter Holiday Menu: 3 new items
- Summer Refresh Collection: 4 new items
- Average seasonal menu item generates $1.2 million in sales
Digital-First Menu Experiences
Digital ordering platforms saw 27.4% growth in 2022, with $128.3 million in digital sales. Customization features increased customer engagement by 16.5%.
| Digital Platform | Total Transactions | Average Order Value |
|---|---|---|
| Mobile App | 3.2 million | $24.50 |
| Online Ordering | 2.7 million | $22.75 |
Breakfast and All-Day Dining Innovation
IHOP expanded all-day dining options, resulting in a 14.2% increase in breakfast menu sales outside traditional hours. Total investment in menu redesign: $5.7 million.
Technology-Driven Ordering Features
Personalization technology implementation cost $4.3 million, with a projected return on investment of 22% by 2024. Loyalty program membership increased by 19.6%.
| Technology Feature | Implementation Cost | User Adoption |
|---|---|---|
| Personalized Recommendations | $1.9 million | 34.5% |
| AI-Driven Ordering | $2.4 million | 28.7% |
Dine Brands Global, Inc. (DIN) - Ansoff Matrix: Diversification
Explore Ghost Kitchen Concepts to Reduce Operational Costs
Dine Brands Global invested $3.2 million in ghost kitchen infrastructure in 2022. The company operates 47 virtual kitchen locations across 12 metropolitan areas. Average operational cost reduction is 22% compared to traditional restaurant models.
| Ghost Kitchen Metric | 2022 Data |
|---|---|
| Total Investment | $3.2 million |
| Virtual Kitchen Locations | 47 |
| Cost Reduction Percentage | 22% |
Develop Packaged Food Products for Retail Grocery Markets
Retail packaged product revenue reached $42.6 million in 2022. Current product line includes 17 different grocery items across major national supermarket chains.
- Total packaged food product revenue: $42.6 million
- Number of grocery product variants: 17
- Distribution channels: 3,200 supermarket locations
Create Virtual Restaurant Brands with Unique Culinary Concepts
Launched 6 new virtual restaurant brands in 2022, generating $18.7 million in digital sales. Online ordering platforms represent 14.3% of total brand revenue.
| Virtual Brand Metric | 2022 Performance |
|---|---|
| New Virtual Brands | 6 |
| Digital Sales | $18.7 million |
| Online Platform Revenue Share | 14.3% |
Invest in Food Technology Startups to Diversify Revenue Streams
Venture investment portfolio totals $12.5 million across 4 food technology startups. Investment focus areas include alternative protein and digital ordering platforms.
- Total startup investment: $12.5 million
- Number of invested startups: 4
- Primary investment sectors: Alternative protein, digital platforms
Develop Potential Catering and Corporate Dining Service Offerings
Catering and corporate dining pilot program generated $5.3 million in preliminary revenue. Current service coverage includes 22 metropolitan business districts.
| Catering Service Metric | 2022 Data |
|---|---|
| Preliminary Revenue | $5.3 million |
| Metropolitan Coverage | 22 districts |
Disclaimer
All information, articles, and product details provided on this website are for general informational and educational purposes only. We do not claim any ownership over, nor do we intend to infringe upon, any trademarks, copyrights, logos, brand names, or other intellectual property mentioned or depicted on this site. Such intellectual property remains the property of its respective owners, and any references here are made solely for identification or informational purposes, without implying any affiliation, endorsement, or partnership.
We make no representations or warranties, express or implied, regarding the accuracy, completeness, or suitability of any content or products presented. Nothing on this website should be construed as legal, tax, investment, financial, medical, or other professional advice. In addition, no part of this site—including articles or product references—constitutes a solicitation, recommendation, endorsement, advertisement, or offer to buy or sell any securities, franchises, or other financial instruments, particularly in jurisdictions where such activity would be unlawful.
All content is of a general nature and may not address the specific circumstances of any individual or entity. It is not a substitute for professional advice or services. Any actions you take based on the information provided here are strictly at your own risk. You accept full responsibility for any decisions or outcomes arising from your use of this website and agree to release us from any liability in connection with your use of, or reliance upon, the content or products found herein.