
|
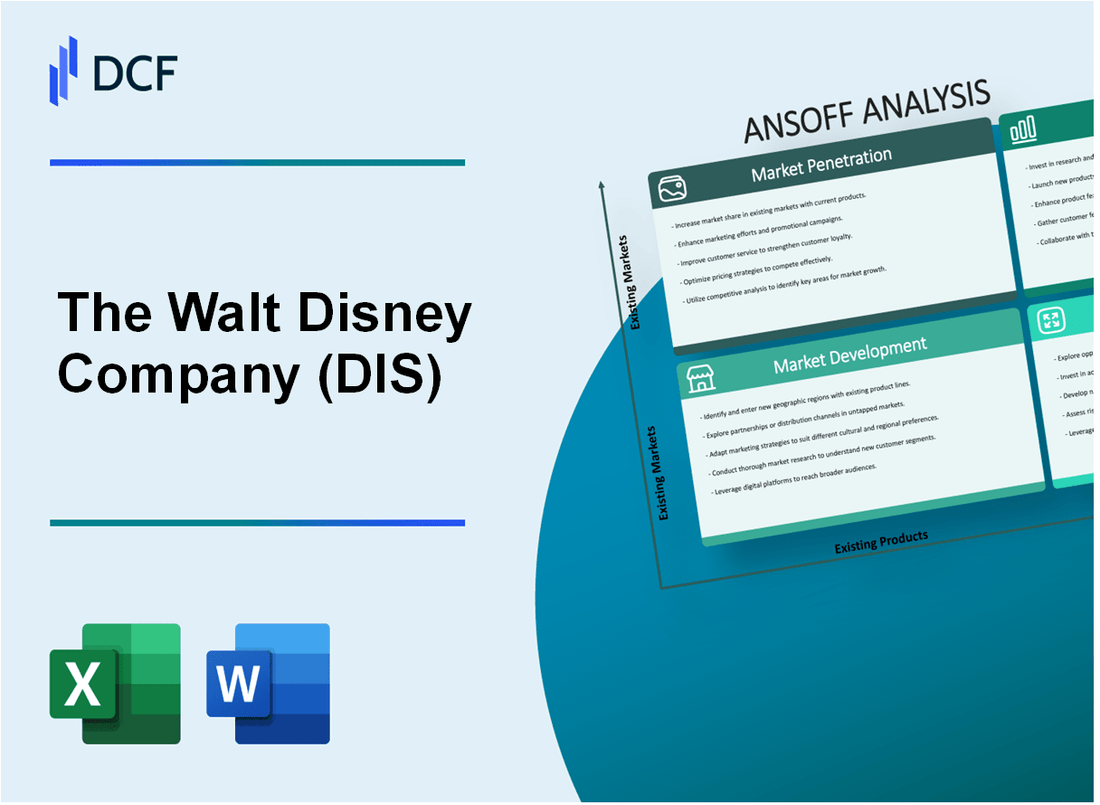
The Walt Disney Company (DIS): ANSOFF MATRIX [Dec-2025 Updated] |
Fully Editable: Tailor To Your Needs In Excel Or Sheets
Professional Design: Trusted, Industry-Standard Templates
Investor-Approved Valuation Models
MAC/PC Compatible, Fully Unlocked
No Expertise Is Needed; Easy To Follow
The Walt Disney Company (DIS) Bundle
You're looking for the clearest map to The Walt Disney Company's next big growth phase, and honestly, the Ansoff Matrix is the right framework for that. As a financial analyst who's spent two decades mapping corporate strategy, I see four distinct, actionable paths supported by their $94.4 billion fiscal year 2025 revenue. We're talking about everything from driving the core Disney+ ARPU past $7.55 to making a brand new, high-risk bet like integrating that $1.5 billion Epic Games investment into a persistent entertainment universe. This isn't abstract; it's a precise breakdown of near-term opportunities and risks. The next move is always in the details below.
The Walt Disney Company (DIS) - Ansoff Matrix: Market Penetration
You're looking at how The Walt Disney Company is pushing harder into its existing markets-the core streaming base and the domestic parks-to grow revenue and profit from what it already has. This is about maximizing the value of the current customer base.
Drive Disney+ Core Average Revenue Per User (ARPU) above the Q1 2025 rate of $7.55.
The goal here is to lift the revenue extracted from each existing Disney+ subscriber. For the first quarter of fiscal 2025, the Domestic Disney+ ARPU actually settled at $7.99, which is above the $7.55 benchmark you mentioned. International Disney+ ARPU for that same period was reported at $7.19. This shows pricing power in the domestic market, though the international rate is lower. The overall Disney+ Core subscriber base ended Q4 Fiscal 2025 at 132 million subscribers. Still, the value proposition is being tested; subscriber agreements updated in early 2025 clarified that 'ad free' tiers may include ads for live content like sports.
Increase domestic park yield via dynamic pricing and premium add-ons like Genie+.
The Experiences segment is clearly focused on yield improvement. In Q3 2025, U.S.-based parks generated $6.4 billion in revenue and $1.6 billion in operating income. For Q4 2025, Domestic Parks & Experiences operating income grew 9% year-over-year to $920 million. This yield focus is evident in guest spending, which saw per-night spending up 5% in Q1 2025, driven by premium services like Lightning Lane Premier Pass. The company is actively testing broader yield management; CFO Hugh Johnston confirmed dynamic pricing is running in Disneyland Paris for about a year with 'very good start' results, with optimization before a potential U.S. introduction. Lightning Lane is already a key area where this focus on incremental revenue is visible.
Convert more of the 132 million Disney+ subscribers to the higher-margin ad-free tier.
While the total Disney+ base reached 132 million subscribers by the end of Q4 Fiscal 2025, the split between tiers is a key lever. Projections suggest that nearly 40% of Disney+ subscribers in the U.S. and Canada are expected to opt for the ad-supported tier. To push users to the higher-margin ad-free tier, The Walt Disney Company has been integrating other services, such as adding an ESPN tile to Disney+ for bundle subscribers, which was noted in the Q1 2025 commentary.
Maximize box office revenue from major 2025 film releases through aggressive marketing.
The theatrical slate for the latter part of 2025 includes tentpoles designed to drive significant revenue. Zootopia 2 is projected for a domestic debut of $125+ million over the five-day Thanksgiving weekend. Avatar: Fire and Ash is expected to follow the previous installments' over $2 billion worldwide gross. In contrast, the live-action Snow White underperformed, earning only $205.6 million globally. The Fantastic Four: First Steps had earlier projections in the $850 million to $900 million range worldwide.
Offer deeper cross-segment bundles, like park discounts for annual streaming subscribers.
The strategy involves connecting the streaming and experiences segments to lock in customers. While specific park discount data for annual streaming subscribers isn't public, the integration of ESPN content directly into the Disney+ platform is a concrete example of cross-segment value addition, aiming to increase the perceived value of the core subscription.
Here are the key figures supporting the Market Penetration strategy:
| Metric | Value/Rate | Period/Context |
| Domestic Disney+ Core ARPU | $7.99 | Q1 Fiscal 2025 |
| International Disney+ Core ARPU | $7.19 | Q1 Fiscal 2025 |
| Total Disney+ Subscribers | 132 million | End of Q4 Fiscal 2025 |
| Domestic Parks Revenue | $6.4 billion | Q3 2025 |
| Domestic Parks Operating Income Growth | 9% | Q4 2025 vs. Prior Year |
| Domestic Guest Per-Night Spending Increase | 5% | Q1 2025 |
| Projected Domestic Debut for Zootopia 2 | $125+ million | Thanksgiving Weekend 2025 |
| Snow White Global Box Office Total | $205.6 million | 2025 Release |
The focus remains on extracting more revenue from the existing user base, whether through higher streaming prices, increased per-guest spending at parks, or driving adoption of premium, higher-priced streaming tiers.
- Drive Domestic Disney+ ARPU above $7.55.
- Increase yield via premium add-ons like Lightning Lane.
- Convert more of the 132 million Disney+ subscribers to ad-free.
- Target major box office returns from Zootopia 2 and Avatar: Fire and Ash.
- Leverage cross-segment value with integrated content like the ESPN tile.
Finance: draft 13-week cash view by Friday.
The Walt Disney Company (DIS) - Ansoff Matrix: Market Development
The Walt Disney Company is actively pursuing new markets for its existing offerings, a classic Market Development strategy under the Ansoff Matrix.
The Disney Cruise Line is utilizing the new homeport in Singapore for the Disney Adventure, commencing sailings year-round starting in 2025 for at least a five-year commitment. This vessel is estimated to accommodate approximately 6,000 to 6,700 passengers. The company expects total pre-opening expenses related to Disney Cruise Line expansion to be approximately $200 million for the full fiscal year 2025. For instance, a three-night cruise on the Disney Adventure from Singapore in January 2026 was priced at $4,194 for a family of four.
For streaming, Disney Plus surpassed 300 million global subscribers as of August 2025. The Europe, Middle East, and Africa (EMEA) region generated $5.5 billion in revenue last year, with a 4.4% rise in turnover, supported by the introduction of new subscription tiers. The company previously planned for 50 originals on Star, its international programming hub, by 2024.
In Consumer Products, The Walt Disney Company topped the global licensing business with total annual retail sales reaching $62 billion in 2025. This is significantly higher than competitors like Authentic Brands Group at $32 billion. The revenue from Stitch-themed consumer products alone reached $2.6 billion in fiscal 2024.
ESPN is expanding its global reach by securing international sports rights. For the second fiscal quarter of 2025, ESPN international revenue grew 11% to $379 million. ESPN+ subscribers fell 3% to 24.1 million in that same quarter. ESPN holds the rights for the expanded College Football Playoff through the 2031-32 season.
The Experiences segment, which includes Parks, is projected for 6% to 8% segment operating income growth for the full fiscal year 2025. Domestic Parks & Experiences operating income showed strong growth of 22% year-over-year in the third fiscal quarter of 2025.
| Market Development Initiative | Financial/Statistical Metric | Amount/Value | Period/Context |
| Disney Cruise Line - Singapore Homeport | Estimated Passenger Capacity (Disney Adventure) | 6,000 to 6,700 | Per Ship |
| Disney Cruise Line - Fleet Expansion | Total Pre-Opening Expense Estimate (FY 2025) | ~$200 million | Fiscal Year 2025 Projection |
| Disney Cruise Line - Singapore Itinerary Pricing | 3-Night Cruise Price Estimate (Family of Four) | $4,194 | January 2026 Sailing |
| Streaming - International Growth (EMEA) | Revenue (Last Year) | $5.5 billion | Europe, Middle East, and Africa |
| Streaming - Global Reach | Disney+ Global Subscribers | >300 million | August 2025 |
| Consumer Products - Global Licensing | Total Annual Retail Sales (2025) | $62 billion | 2025 Fiscal Year |
| ESPN - International Performance | International Revenue (Q2 2025) | $379 million | Q2 Fiscal 2025 |
| ESPN - Subscriber Base | ESPN+ Subscribers | 24.1 million | Q2 Fiscal 2025 |
The Experiences segment is projected for 6% to 8% segment operating income growth for the full fiscal year 2025.
- Disney+ added 1.4 million subscribers sequentially to reach 126.0 million in Q2 fiscal 2025.
- Disney+ added 1.8 million subscribers sequentially to reach 128 million in Q3 fiscal 2025.
- Total Disney+ and Hulu subscriptions reached 180.7 million in Q2 fiscal 2025.
- Total Disney+ and Hulu subscriptions reached 183 million in Q3 fiscal 2025.
- Domestic ESPN revenue grew 7% in Q2 fiscal 2025.
- Domestic advertising revenue for ESPN grew 29% in Q2 fiscal 2025.
- The company's overall adjusted EPS guidance for Fiscal Year 2025 was $5.75, an 18% increase over fiscal 2024, with a revised projection of $5.85 in Q3 2025.
ESPN holds the rights for the College Football Playoff through the 2031-32 season.
The Walt Disney Company (DIS) - Ansoff Matrix: Product Development
You're looking at The Walt Disney Company's strategy to grow by introducing new products and services to its existing markets-the Product Development quadrant of the Ansoff Matrix. This involves significant capital deployment and technological leaps to keep the core consumer base engaged.
A major component of this strategy is the massive capital investment in the physical footprint. The Walt Disney Company is developing plans to invest roughly $60 billion in its Parks, Experiences and Products segment over approximately 10 years. A portion of this is earmarked for domestic park lands, with specific plans including a new Villains-themed land at Magic Kingdom in Walt Disney World, Florida. For context, the Walt Disney World Resort specifically could see as much as $17 billion spent over the next 10 to 20 years.
The digital product expansion is headlined by the launch of the ESPN Direct-to-Consumer (DTC) streaming service. This new product officially launched on Thursday, August 21, 2025. The service offers an unlimited plan priced at $29.99 per month, which includes access to all ESPN linear networks and covers approximately 47,000 live events annually. There is a special introductory bundle offer with Disney+ and Hulu for the same $29.99 per month for the first 12 months. This move follows strong performance in the broader DTC segment, which posted $6.6 billion in revenues in Q3 FY25, marking a 14% year-over-year increase.
Technological innovation is driving new character experiences. Walt Disney Imagineering debuted a next-generation, fully interactive robotic figure of Olaf, which uses artificial intelligence, specifically reinforcement learning, for realistic movement. This advanced character will be deployed in early 2026 at the World of Frozen in Disneyland Paris and Hong Kong Disneyland. The Disneyland Paris expansion, which includes this new land, is part of a €2 billion ($2.3 billion) investment in that resort.
The focus on new content for Disney+ involves developing high-budget, original series based on less-utilized intellectual property (IP). While a specific budget for this niche is not itemized, overall content spending for The Walt Disney Company across all streaming services was projected to be in the range of $14-16 billion annually by fiscal year 2024, with $8-9 billion earmarked for Disney+ itself. The company is actively managing this spend, having reduced its content budget from a peak of $33 billion in 2022 down to $23 billion in 2024, signaling a pivot toward more efficient, high-quality output.
To blend physical and digital engagement in parks, The Walt Disney Company is heavily investing in mixed reality (XR). They established the Office of Technology Enablement (OTE) to coordinate these initiatives. This includes exploring technologies that allow guests to engage with virtual characters without needing headsets, such as the experimental "Magic Bench" concept. This technological push is funded within the overall $60 billion, 10-year parks investment plan, with 30% of that capital allocated to technology and maintenance.
Here is a summary of the key financial and statistical data points related to these Product Development initiatives:
| Initiative Area | Key Metric/Amount | Context/Timing |
|---|---|---|
| Parks Capital Investment | $60 billion | Total planned CapEx over approximately 10 years |
| Walt Disney World Expansion | Up to $17 billion | Planned investment over the next 10 to 20 years for the resort |
| ESPN DTC Unlimited Plan Price | $29.99 per month | Launch date was August 21, 2025 |
| ESPN DTC Live Events | 47,000 annually | Included in the $29.99/month unlimited plan |
| Robotic Olaf Deployment | Early 2026 | Debut at Disneyland Paris and Hong Kong Disneyland |
| Disney+ Annual Content Spend (FY24 Target) | $8-9 billion | Part of a total streaming content spend of $14-16 billion |
| Q3 FY25 DTC Revenue | $6.6 billion | Up 14% Year-over-Year |
The development of next-generation robotics like Olaf, which uses reinforcement learning, is part of the technology allocation within the larger capital plan. The overall content budget saw a reduction from $33 billion in 2022 to $23 billion in 2024, emphasizing efficiency alongside new IP development.
- Invest in new domestic park lands, such as the Villains-themed area.
- Launch ESPN DTC streaming service on August 21, 2025.
- Develop next-generation, interactive robotic characters like Olaf for park meet-and-greets.
- Create new, high-budget, original series for Disney+ using less-utilized IP.
- Roll out new mixed reality experiences, such as the headset-free "Magic Bench" concept.
The Walt Disney Company's Parks segment operating income quadrupled over the last decade while aggregate investment increased by three times, suggesting an improved return on capital investment.
The Walt Disney Company (DIS) - Ansoff Matrix: Diversification
You're looking at the diversification quadrant of The Walt Disney Company's Ansoff strategy, which means we're talking about entirely new markets with entirely new products. This is where the biggest potential upside lives, but also where the capital allocation risk is highest. Honestly, the recent moves show a clear intent to build new revenue streams outside the core film, linear TV, and traditional park experiences.
The $1.5 billion investment in Epic Games is the anchor for this strategy, aiming to build a new, persistent, interactive entertainment universe. This isn't just a content deal; it's an equity stake, reportedly 9% pending regulatory approval, marking what CEO Robert A. Iger called Disney's 'biggest entry ever into the world of games'. The goal is an 'expansive and open games and entertainment universe' where fans can 'play, watch, create, and shop'. This move directly addresses the need to capture value in the metaverse-adjacent space, leveraging Unreal Engine technology for a 'transformational new games and entertainment universe'.
To give you some context on the financial base supporting these big bets, here's a snapshot of fiscal 2025 performance, which is the backdrop for this diversification push:
| Metric | FY 2025 Actual | YoY Change |
| Total Revenue | $94.4 billion | Up 3% |
| Total Segment Operating Income | $17.6 billion | Up 12% |
| Adjusted EPS | $5.93 | Up 19% |
| Experiences Segment Operating Income | $10.0 billion | Record |
| Consumer Products Merchandise (Stitch) Sales | Eclipsing $4 billion | Growing |
Next, consider monetizing the Disney Select AI Engine. At CES 2025, Disney unveiled this machine learning platform designed for targeted advertising insights. The diversification here is offering this proprietary tool, which analyzes vast datasets, to third-party advertisers. While the search results confirm the engine's existence and its role in enhancing marketing efficiency, the specific revenue generated or projected from offering this tool externally isn't detailed yet. Still, Disney Advertising emphasizes its proprietary built, not bought, technology across its portfolio. If onboarding takes too long, the competitive advantage of this data moat could erode.
For the physical footprint, the push into high-end, non-IP-specific luxury resorts targets the affluent non-family traveler segment, a clear market shift from their traditional family focus. We see existing investment plans that support capacity expansion. For instance, the Disneyland Resort expansion is planned to cost up to $2.5 billion over 10 years. Furthermore, the 2045 Comprehensive Plan for Walt Disney World includes an increment maximum of around 13,000 new hotel rooms. The Swan and Dolphin Resort convention space expansion alone has an updated price tag of more than $300 million. The estimated overnight guest population at Disney World for 2025 is 102,183 people, so adding high-yield, non-family-focused inventory makes sense to diversify the per-capita spend.
Entering the competitive gaming market via a major e-sports league acquisition is a logical next step following the Epic Games deal, though a specific acquisition target or price isn't public. We know ESPN Esports launched in January 2016, and Disney previously considered Epic Games and aXiomatic as potential leads in the esports arena. This move would be about securing a new sports product vertical with established audience engagement metrics, similar to how they secured long-term rights for the NFL and NBA.
Finally, developing a proprietary educational technology platform using Disney IP for K-12 digital learning represents a move into a distinct, regulated market. While no specific platform launch or investment figure is available, the Disney Accelerator program has a focus on areas like connected play and has previously invested in EdTech startups like Kahoot. To be fair, the EdTech landscape in 2025 is diverse, with some platforms serving over 90,000+ students. Disney's IP advantage here would be in content engagement, but they'd need to navigate the regulatory and data privacy requirements for K-12, which is a different beast than streaming content moderation.
Here are the key strategic thrusts under Diversification:
- Integrate $1.5 billion Epic Games investment for an interactive universe.
- Offer Disney Select AI Engine tools to third-party advertisers.
- Target affluent non-family travelers with new luxury resorts.
- Acquire a major e-sports league for a new sports product.
- Develop proprietary K-12 EdTech platform using existing IP.
Finance: draft the capital expenditure schedule for the $2.5 billion Disneyland expansion by next Wednesday.
Disclaimer
All information, articles, and product details provided on this website are for general informational and educational purposes only. We do not claim any ownership over, nor do we intend to infringe upon, any trademarks, copyrights, logos, brand names, or other intellectual property mentioned or depicted on this site. Such intellectual property remains the property of its respective owners, and any references here are made solely for identification or informational purposes, without implying any affiliation, endorsement, or partnership.
We make no representations or warranties, express or implied, regarding the accuracy, completeness, or suitability of any content or products presented. Nothing on this website should be construed as legal, tax, investment, financial, medical, or other professional advice. In addition, no part of this site—including articles or product references—constitutes a solicitation, recommendation, endorsement, advertisement, or offer to buy or sell any securities, franchises, or other financial instruments, particularly in jurisdictions where such activity would be unlawful.
All content is of a general nature and may not address the specific circumstances of any individual or entity. It is not a substitute for professional advice or services. Any actions you take based on the information provided here are strictly at your own risk. You accept full responsibility for any decisions or outcomes arising from your use of this website and agree to release us from any liability in connection with your use of, or reliance upon, the content or products found herein.