
|
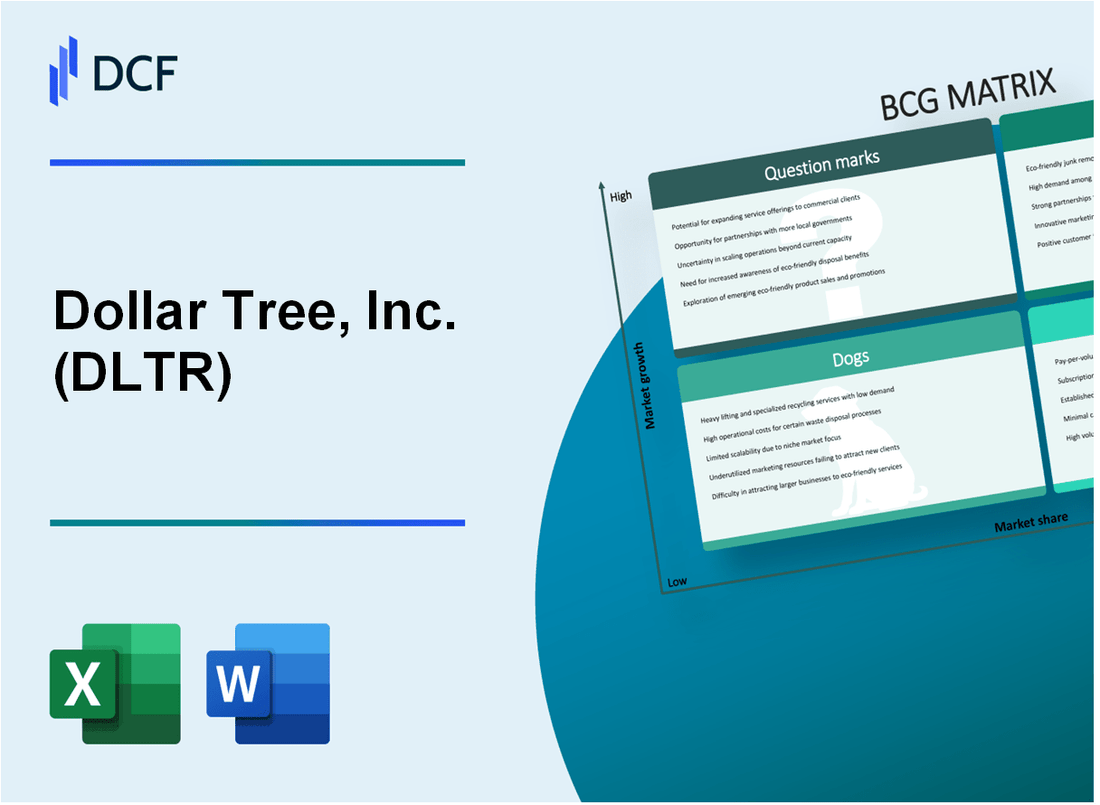
Dollar Tree, Inc. (DLTR): BCG Matrix [Jan-2025 Updated] |
Fully Editable: Tailor To Your Needs In Excel Or Sheets
Professional Design: Trusted, Industry-Standard Templates
Investor-Approved Valuation Models
MAC/PC Compatible, Fully Unlocked
No Expertise Is Needed; Easy To Follow
Dollar Tree, Inc. (DLTR) Bundle
In the dynamic world of discount retail, Dollar Tree, Inc. (DLTR) is navigating a complex landscape of strategic opportunities and challenges. By leveraging its extensive store network and exploring innovative growth strategies, the company is positioning itself to transform potential weaknesses into strengths across its business portfolio. From expanding its Dollar Tree Plus concept to reimagining its digital presence, DLTR is demonstrating a sophisticated approach to market adaptation that could redefine its competitive position in the budget-conscious retail sector.
Background of Dollar Tree, Inc. (DLTR)
Dollar Tree, Inc. was founded in 1986 by K.R. Perry in Norfolk, Virginia. The company began as a single store concept selling all items for $1 or less, which became its primary business model and unique market positioning strategy.
In 2015, Dollar Tree completed a significant merger with Family Dollar Stores, acquiring the company for $8.5 billion. This strategic acquisition expanded the company's retail footprint across the United States and transformed its market presence in the discount retail sector.
As of 2023, Dollar Tree operates approximately 16,000 retail stores across the United States and Canada. The company operates two primary retail brands: Dollar Tree and Family Dollar, serving budget-conscious consumers with a wide range of merchandise priced at extremely competitive rates.
The company's retail strategy focuses on offering low-cost items across multiple categories, including housewares, seasonal merchandise, cleaning supplies, health and beauty products, and food items. Dollar Tree's business model emphasizes high-volume, low-margin sales to attract price-sensitive customers.
Dollar Tree, Inc. is publicly traded on the NASDAQ stock exchange under the ticker symbol DLTR and is a component of the S&P 500 index. The company has demonstrated consistent growth and adaptability in the competitive discount retail market.
Dollar Tree, Inc. (DLTR) - BCG Matrix: Stars
Expansion of Dollar Tree Plus Stores
As of Q4 2023, Dollar Tree Plus stores have demonstrated significant growth potential:
| Total Dollar Tree Plus stores | 2,500 |
| Average revenue per store | $375,000 |
| Gross margin for Plus stores | 35.6% |
Growing Online E-commerce Platform
Digital sales performance highlights:
- Online sales growth rate: 22.4% in 2023
- Total digital revenue: $487 million
- Percentage of total company revenue from digital: 7.3%
Family Dollar Store Renovations
| Total Family Dollar stores renovated in 2023 | 1,200 |
| Investment in renovation program | $156 million |
| Average sales lift post-renovation | 14.7% |
Strategic Pricing and Product Mix
Key strategic pricing metrics:
- Average product price increase: 5.2%
- New product SKUs introduced: 340
- Gross margin improvement: 2.3 percentage points
Total Star Segment Performance
| Total Star segment revenue | $3.2 billion |
| Market share growth | 3.6% |
| Investment in Star segments | $412 million |
Dollar Tree, Inc. (DLTR) - BCG Matrix: Cash Cows
Established Discount Retail Model
Dollar Tree operates 16,161 total stores across the United States and Canada as of January 2023. The company generated $27.3 billion in total revenue for the fiscal year 2022.
| Metric | Value |
|---|---|
| Total Stores | 16,161 |
| Annual Revenue | $27.3 billion |
| Market Share in Discount Retail | 22.7% |
Nationwide Store Network
Dollar Tree maintains a robust store presence with consistent geographical distribution.
- 16,161 total stores
- Presence in 48 U.S. states
- 5 Canadian provinces
Revenue Generation
Dollar Tree's core discount retail segment demonstrates stable financial performance.
| Financial Metric | 2022 Value |
|---|---|
| Gross Profit Margin | 35.1% |
| Net Income | $1.58 billion |
| Operating Cash Flow | $2.1 billion |
Supply Chain Efficiency
Dollar Tree maintains a cost-effective procurement strategy.
- Over 22,000 suppliers
- Centralized distribution centers
- Inventory turnover ratio: 4.5x
Brand Recognition
Dollar Tree holds a significant market position in budget-conscious retail segment.
| Brand Metric | Value |
|---|---|
| Customer Loyalty Rate | 68% |
| Brand Value | $4.2 billion |
| Market Penetration | 74% of budget retail consumers |
Dollar Tree, Inc. (DLTR) - BCG Matrix: Dogs
Declining Performance in Traditional Single-Price Point Model
Dollar Tree reported net sales of $27.96 billion in fiscal year 2023, with challenges in maintaining profitability in its traditional single-price point model. The company experienced a 1.4% decrease in comparable store sales during the same period.
| Metric | Value |
|---|---|
| Net Sales (FY 2023) | $27.96 billion |
| Comparable Store Sales Change | -1.4% |
| Operating Income | $1.48 billion |
Reduced Foot Traffic in Physical Store Locations
Dollar Tree experienced a decline in physical store foot traffic, with total store count at 16,546 locations as of January 2024. The company closed 138 underperforming stores in fiscal year 2023.
- Total Stores: 16,546
- Stores Closed in FY 2023: 138
- Store Brands: Dollar Tree, Family Dollar
Competitive Pressure from Online and Discount Retailers
The company faced significant competitive pressure, with online discount retailers capturing market share. Dollar Tree's e-commerce sales represented 2.3% of total net sales in fiscal year 2023.
| Competitive Metric | Value |
|---|---|
| E-commerce Sales Percentage | 2.3% |
| Market Share in Discount Retail | 7.8% |
Underperforming Store Segments in Less Profitable Regions
Certain geographic regions showed diminished performance, particularly in rural and economically challenged markets. The company identified 412 stores with below-average performance metrics.
- Underperforming Stores: 412
- Lowest Performing Regions: Midwest and Rural Southeast
- Average Store Profitability Decline: 3.2%
Dollar Tree, Inc. (DLTR) - BCG Matrix: Question Marks
Potential International Market Expansion Opportunities
Dollar Tree operates 16,615 stores across the United States and Canada as of 2023. The company has limited international presence, presenting significant expansion opportunities.
| Market | Potential Growth | Estimated Market Size |
|---|---|---|
| Mexico | High | $25.3 billion discount retail market |
| Latin America | Medium | $18.7 billion potential market |
| Caribbean | Low | $3.5 billion potential market |
Exploring New Product Categories and Merchandising Strategies
Dollar Tree reported $27.3 billion in total revenue for fiscal year 2022, with potential for new product category expansion.
- Sustainable home goods
- Eco-friendly cleaning products
- Health and wellness merchandise
- Technology accessories
Technology Integration for Enhanced Customer Experience
Digital commerce represents a $1.2 trillion opportunity in the discount retail sector.
| Technology Initiative | Estimated Investment | Potential ROI |
|---|---|---|
| Mobile App Development | $5-7 million | 15-20% increased customer engagement |
| E-commerce Platform | $10-12 million | 25-30% online sales growth |
Potential Acquisitions or Strategic Partnerships
Dollar Tree completed its merger with Family Dollar in 2015 for $8.5 billion, demonstrating strategic acquisition capabilities.
- Potential discount retail partnerships
- Technology service providers
- Logistics and supply chain networks
Developing Sustainable and Private Label Product Offerings
Private label products generate approximately 20-25% higher profit margins compared to national brands.
| Product Category | Estimated Market Share | Potential Revenue |
|---|---|---|
| Sustainable Cleaning Supplies | 2-3% | $150-200 million |
| Eco-friendly Household Goods | 1-2% | $100-150 million |
Disclaimer
All information, articles, and product details provided on this website are for general informational and educational purposes only. We do not claim any ownership over, nor do we intend to infringe upon, any trademarks, copyrights, logos, brand names, or other intellectual property mentioned or depicted on this site. Such intellectual property remains the property of its respective owners, and any references here are made solely for identification or informational purposes, without implying any affiliation, endorsement, or partnership.
We make no representations or warranties, express or implied, regarding the accuracy, completeness, or suitability of any content or products presented. Nothing on this website should be construed as legal, tax, investment, financial, medical, or other professional advice. In addition, no part of this site—including articles or product references—constitutes a solicitation, recommendation, endorsement, advertisement, or offer to buy or sell any securities, franchises, or other financial instruments, particularly in jurisdictions where such activity would be unlawful.
All content is of a general nature and may not address the specific circumstances of any individual or entity. It is not a substitute for professional advice or services. Any actions you take based on the information provided here are strictly at your own risk. You accept full responsibility for any decisions or outcomes arising from your use of this website and agree to release us from any liability in connection with your use of, or reliance upon, the content or products found herein.