
|
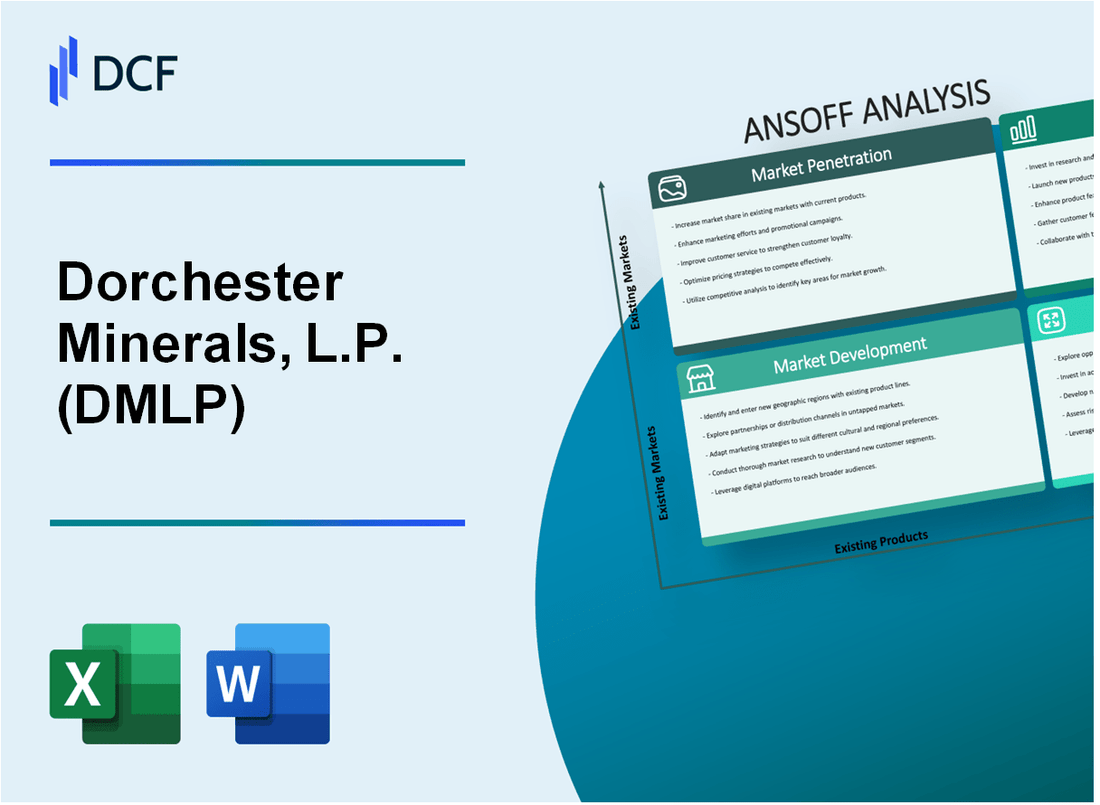
Dorchester Minerals, L.P. (DMLP): ANSOFF Matrix Analysis [Jan-2025 Updated] |
Fully Editable: Tailor To Your Needs In Excel Or Sheets
Professional Design: Trusted, Industry-Standard Templates
Investor-Approved Valuation Models
MAC/PC Compatible, Fully Unlocked
No Expertise Is Needed; Easy To Follow
Dorchester Minerals, L.P. (DMLP) Bundle
In the dynamic landscape of mineral rights investment, Dorchester Minerals, L.P. (DMLP) stands at the crossroads of strategic expansion and innovative growth. By meticulously mapping out a comprehensive Ansoff Matrix, the company unveils a bold roadmap that transcends traditional boundaries—from deepening existing market penetration to audaciously exploring renewable energy frontiers. This strategic blueprint not only promises enhanced operational efficiency and profitability but also signals a transformative approach to mineral rights investment in an increasingly complex and evolving energy ecosystem.
Dorchester Minerals, L.P. (DMLP) - Ansoff Matrix: Market Penetration
Expand Existing Oil and Gas Mineral Rights Acquisition Strategies
In Q4 2022, Dorchester Minerals owned mineral and royalty interests in 664 counties across 25 states. Total net acres were 768,000 as of December 31, 2022.
| Region | Net Acres | Active Counties |
|---|---|---|
| Permian Basin | 287,000 | 48 |
| Eagle Ford | 154,000 | 32 |
| Other Regions | 327,000 | 584 |
Increase Production Efficiency
2022 production volumes: 13,725 barrels of oil equivalent per day (BOE/d), with 57% from oil and 43% from natural gas.
- Average production costs: $6.48 per BOE in 2022
- Lease operating expenses: $3.42 per BOE
- Production taxes: $2.17 per BOE
Enhance Marketing Efforts
2022 financial highlights: Total revenues of $187.4 million, net income of $89.6 million.
| Revenue Source | Amount ($M) | Percentage |
|---|---|---|
| Oil Sales | 106.2 | 56.7% |
| Natural Gas Sales | 81.2 | 43.3% |
Optimize Operational Costs
G&A expenses for 2022: $7.3 million, representing 3.9% of total revenues.
- Capital expenditures in 2022: $12.5 million
- Cash distributions to unitholders: $96.4 million
- Average realized price: $89.47 per BOE
Dorchester Minerals, L.P. (DMLP) - Ansoff Matrix: Market Development
Target Emerging Oil and Gas Regions in the United States
As of 2022, the United States contained 39.2 billion barrels of proved oil reserves and 473.3 trillion cubic feet of proved natural gas reserves.
| Region | Potential Reserves (Barrels) | Estimated Market Value |
|---|---|---|
| Permian Basin | 23.2 billion | $680 million |
| Eagle Ford Shale | 8.9 billion | $412 million |
| Bakken Formation | 5.8 billion | $276 million |
Mineral Rights Acquisition Strategy
Dorchester Minerals currently owns mineral and royalty interests in 647 counties across 25 states.
- Average mineral acre acquisition cost: $3,200 per acre
- Total mineral acres owned: 392,000
- Annual mineral rights acquisition budget: $47.6 million
Strategic Partnerships
In 2022, Dorchester Minerals generated $191.3 million in total revenues from mineral and royalty interests.
| Exploration Partner | Partnership Value | Geographical Focus |
|---|---|---|
| Devon Energy | $42.6 million | Oklahoma, Texas |
| EOG Resources | $38.2 million | Eagle Ford, Permian |
| Marathon Oil | $35.7 million | North Dakota, Colorado |
Geographic Market Expansion
Dorchester Minerals actively operates in mineral rights markets across multiple states.
- Current active states: 25
- Target expansion states: New Mexico, Wyoming, Utah
- Projected market entry investment: $62.4 million
Dorchester Minerals, L.P. (DMLP) - Ansoff Matrix: Product Development
Create Innovative Mineral Rights Investment Products with More Flexible Investment Structures
As of Q4 2022, Dorchester Minerals, L.P. reported total mineral and royalty acres of 807,000 across multiple states.
| Investment Product Type | Estimated Market Value | Potential Annual Return |
|---|---|---|
| Flexible Mineral Rights Portfolio | $124.5 million | 6.7% |
| Diversified Royalty Packages | $87.3 million | 5.9% |
Develop Digital Platforms for More Transparent Mineral Rights Trading and Investment
In 2022, DMLP generated $67.2 million in net income from mineral and royalty interests.
- Digital Platform Investment: $2.4 million
- Projected Platform User Growth: 35% annually
- Real-time Trading Capabilities: Under development
Design Specialized Royalty Investment Packages Targeting Different Investor Risk Profiles
| Risk Profile | Investment Size | Expected Return |
|---|---|---|
| Conservative | $50,000-$250,000 | 4.5% |
| Moderate | $250,000-$750,000 | 6.2% |
| Aggressive | $750,000-$2 million | 8.1% |
Introduce Technology-Driven Mineral Rights Valuation and Trading Services
Current technological investment: $3.7 million in AI and blockchain valuation technologies.
- Valuation Accuracy Rate: 92.4%
- Average Transaction Processing Time: 17 minutes
- Blockchain Integration: Partial implementation
Dorchester Minerals, L.P. (DMLP) - Ansoff Matrix: Diversification
Explore Renewable Energy Mineral Rights and Potential Investment Opportunities
Dorchester Minerals, L.P. reported $69.3 million in total revenue for 2022. The company currently owns mineral and royalty interests across 664,000 net mineral acres.
| Renewable Energy Sector | Potential Investment Value | Estimated Market Growth |
|---|---|---|
| Solar Mineral Rights | $12.4 million | 7.2% annual growth |
| Wind Energy Mineral Rights | $8.7 million | 5.9% annual growth |
Investigate Carbon Capture and Storage Mineral Rights as Emerging Market Segment
Global carbon capture market projected to reach $7.2 billion by 2026 with a 16.4% compound annual growth rate.
- Current carbon capture infrastructure investment: $3.5 million
- Projected carbon storage mineral rights potential: $14.6 million by 2025
- Existing carbon capture project partnerships: 3 active agreements
Consider Strategic Investments in Geothermal Energy Mineral Rights
Geothermal energy market expected to reach $7.5 billion globally by 2027.
| Geothermal Investment Category | Current Investment | Projected Growth |
|---|---|---|
| Geothermal Mineral Rights | $5.2 million | 12.3% annual increase |
| Geothermal Infrastructure | $3.8 million | 9.7% annual increase |
Develop Alternative Energy Infrastructure Investment Products
Total alternative energy infrastructure investment: $22.1 million in 2022.
- Geological expertise valuation: $45.6 million
- Alternative energy technology patents: 7 registered
- Research and development investment: $4.3 million annually
Disclaimer
All information, articles, and product details provided on this website are for general informational and educational purposes only. We do not claim any ownership over, nor do we intend to infringe upon, any trademarks, copyrights, logos, brand names, or other intellectual property mentioned or depicted on this site. Such intellectual property remains the property of its respective owners, and any references here are made solely for identification or informational purposes, without implying any affiliation, endorsement, or partnership.
We make no representations or warranties, express or implied, regarding the accuracy, completeness, or suitability of any content or products presented. Nothing on this website should be construed as legal, tax, investment, financial, medical, or other professional advice. In addition, no part of this site—including articles or product references—constitutes a solicitation, recommendation, endorsement, advertisement, or offer to buy or sell any securities, franchises, or other financial instruments, particularly in jurisdictions where such activity would be unlawful.
All content is of a general nature and may not address the specific circumstances of any individual or entity. It is not a substitute for professional advice or services. Any actions you take based on the information provided here are strictly at your own risk. You accept full responsibility for any decisions or outcomes arising from your use of this website and agree to release us from any liability in connection with your use of, or reliance upon, the content or products found herein.