
|
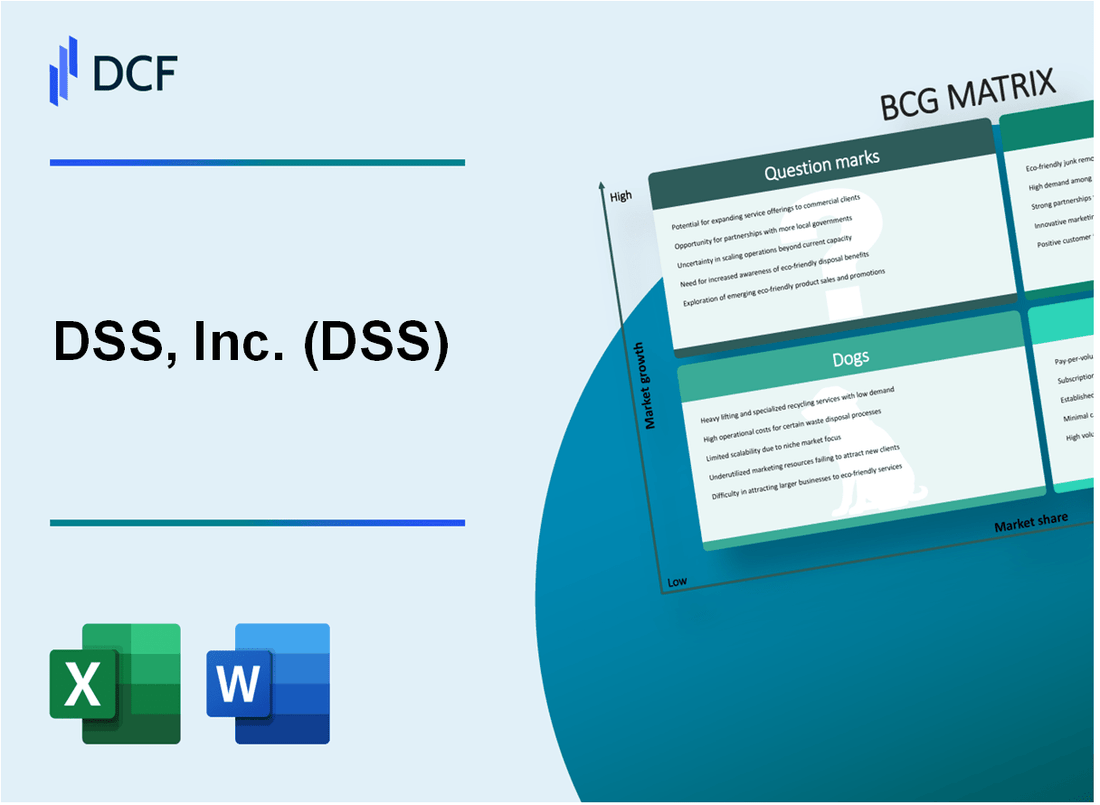
DSS, Inc. (DSS): BCG Matrix [Dec-2025 Updated] |
Fully Editable: Tailor To Your Needs In Excel Or Sheets
Professional Design: Trusted, Industry-Standard Templates
Investor-Approved Valuation Models
MAC/PC Compatible, Fully Unlocked
No Expertise Is Needed; Easy To Follow
DSS, Inc. (DSS) Bundle
You're looking for a clear-eyed view of DSS, Inc.'s diversified portfolio, and the Boston Consulting Group Matrix is the perfect tool to map their near-term strategy. Honestly, the picture is complex: we have the Printed Products segment shining as a Star with a 30% revenue jump in Q1 2025, supported by reliable Cash Cow income from Real Estate that helped pay down over $8 million in debt. But this financial balancing act is strained by Dogs like Commercial Lending and Direct Marketing, which contribute to the $9.18 million net loss year-to-date 2025. The real pivot point is whether the Biotechnology Question Mark, despite a massive 650% revenue spike, can mature fast enough to offset the $7.58 million operational cash burn before the whole structure buckles. Dive in to see exactly where DSS, Inc. must invest, hold, or divest right now.
Background of DSS, Inc. (DSS)
You're looking at DSS, Inc. (NYSE American: DSS) as of late 2025, and honestly, the company presents a picture of active, if somewhat turbulent, financial realignment. DSS, Inc. is a multinational entity that, as of its latest detailed reports, operates across a surprisingly diverse set of business lines. These include Product Packaging, Real Estate, Biotechnology, Commercial Lending, Securities and Investment Management, and Direct Marketing.
The first quarter of 2025 showed some real momentum in their restructuring efforts. DSS reported a 28% year-over-year revenue increase, with total revenues hitting $4.95 million for the period ending March 31, 2025. That growth wasn't just one-off; it was fueled by a 30% jump in printed product sales and a nearly doubling of rental income, which grew from $400,000 to $714,000 in Q1 2025.
The management team, led by CEO Jason Grady, clearly prioritized balance sheet cleanup. They successfully monetized an asset, selling their Plano, TX facility for $9.5 million, and used those proceeds, along with other investments, to pay down over $8 million in total debt. Plus, they strengthened equity by raising $1.5 million through their partner, Impact BioMedical, during that same quarter.
Still, the bottom line remains a challenge; the net loss for Q1 2025 actually widened to $5.30 million, though the operating loss improved to $3.73 million from the prior year's Q1. What this tells us is that while revenue-generating activities are picking up, the underlying cost structure and non-operating charges-like a significant loss on real estate sales-are still weighing heavily on net profitability. The cash burn improved, though, with net cash used in operations decreasing from $2.15 million in Q1 2024 to $1.64 million in Q1 2025.
Looking at the business units themselves, the Product Packaging segment deals in folding cartons and document security printing, while the Biotechnology division, anchored by Impact BioMedical, focuses on human health innovations. Separately, some data suggests DSS is also heavily involved in Healthcare IT solutions, serving entities like the Department of Veterans Affairs with EHR modernization and cloud services. The company also recently made a strategic move by acquiring a European logistics firm, signaling intent to lock in new market footholds as of Q2 2025.
For context on their current trading status near the end of 2025, the stock price was around $1.09 on November 28, 2025, with a 52-week low of $0.72. The company, founded way back in May 1984, is definitely in a phase of strategic pivot, aiming to execute on what they call their 'core verticals.'
DSS, Inc. (DSS) - BCG Matrix: Stars
You're looking at the engine driving DSS, Inc.'s recent top-line momentum, and right now, that's the Printed Products segment. Honestly, the numbers from the first quarter of 2025 tell a clear story of strength in this area. The segment revenue itself grew by a solid 30% in Q1 2025, which was the main force behind the overall company revenue reaching $4.95 million for the period. That kind of growth in a core area is exactly what you want to see when classifying a Star.
Here's a quick look at the key financial context from that quarter:
| Metric | Q1 2025 Value | Comparison/Context |
| Total Revenue | $4.95 million | 28% Year-Over-Year Growth |
| Printed Products Revenue Growth | 30% | Driving overall top-line performance |
| Net Cash Used in Operations | $1.64 million | Improved from $2.15 million in Q1 2024 |
| Cash from Investing Activities | $12.88 million | Primarily from asset sales |
This core Product Packaging business is positioned as a leader in what we can consider a relatively mature market that still shows growth potential, which is why it demands continued investment from DSS, Inc. The global packaging materials market, for instance, is projected to expand at a CAGR of 5.24% between 2025 and 2035, suggesting the underlying market for DSS, Inc.'s offerings is definitely growing. You need to keep feeding the machine when it's performing this well; that's the key tenet here.
The segment's strong performance is crucial, contributing significantly to the Q1 2025 total revenue of $4.95 million. Still, remember that Stars consume large amounts of cash to maintain that high growth and market share, so the net result is often cash-neutral-the money coming in roughly equals the money going out to support promotions and placement. This unit is the one you want to protect.
For DSS, Inc.'s Printed Products segment to transition into a Cash Cow, sustained operational efficiency in this vertical is key to offsetting losses elsewhere in the portfolio. You need to keep these characteristics front-of-mind for this Star:
- High market share in a growing market.
- Leaders in the business unit.
- Require significant support for promotion.
- Likely to grow into Cash Cows if share is kept.
- Consume large amounts of cash due to high growth.
Finance: draft the capital expenditure plan for the Printed Products segment for the next two quarters by next Wednesday.
DSS, Inc. (DSS) - BCG Matrix: Cash Cows
You're looking at the segment of DSS, Inc. that's doing the heavy lifting right now, the reliable engine room. These are the assets that, by definition, have high market share in a mature space and are designed to generate more cash than they consume, funding the riskier ventures.
Real Estate Rental Income nearly doubled in Q1 2025, reaching $714,000, providing reliable cash flow. That's a significant jump from the $400,000 reported in the first quarter of 2024, representing a 78.5% increase in that revenue stream. This segment is definitely acting as a cash generator.
Strategic asset monetization, like the sale of the Plano, TX facility for $9.5 million, generated significant cash for debt reduction. That single transaction contributed heavily to the $12.88 million generated from investing activities during the quarter. Honestly, this kind of disciplined asset management is what you want to see from a Cash Cow unit; it's about extracting maximum value from established assets.
This segment requires minimal new capital expenditure for its existing rental properties, generating cash to fund Question Marks. The operational efficiency is clear when you look at the cash burn improvement. Net cash used in operations improved from $2.15 million in Q1 2024 to $1.64 million in Q1 2025. For the first nine months ending September 30, 2025, the total net cash used in operations was $7.58 million.
Proceeds from asset sales were used to pay down over $8 million in total debt, a smart move for balance sheet optimization. This focus on debt reduction is critical for long-term stability. As of September 30, 2025, current liabilities included $43.15 million of current long-term debt, against cash and cash equivalents of only $7.02 million, so that debt paydown was defintely necessary.
Here's a quick look at the key financial movements related to this cash-generating activity for Q1 2025:
| Metric | Q1 2024 Value | Q1 2025 Value | Change |
| Real Estate Rental Income | $400,000 | $714,000 | 78.5% Increase |
| Plano, TX Facility Sale Proceeds | N/A | $9.5 million | One-time Cash Inflow |
| Total Debt Repaid (Q1) | N/A | Over $8 million | Balance Sheet Impact |
| Net Cash Used in Operations (Q1) | $2.15 million | $1.64 million | Improved Efficiency |
The Cash Cow strategy for DSS, Inc. centers on maximizing the yield from these mature assets while minimizing reinvestment, which translates to tangible balance sheet improvements. You can see the focus on extracting cash through these activities:
- $714,000 in Q1 2025 rental income.
- $12.88 million in net cash from investing activities in Q1 2025.
- Over $8 million reduction in total debt using asset sale proceeds.
- Cash and cash equivalents stood at $7.02 million as of September 30, 2025.
Finance: draft 13-week cash view by Friday, focusing on sustaining the Q1 operational cash flow improvement.
DSS, Inc. (DSS) - BCG Matrix: Dogs
Dogs are units or products with a low market share and low growth rates. They frequently break even, neither earning nor consuming much cash. Dogs are generally considered cash traps because businesses have money tied up in them, even though they bring back almost nothing in return. These business units are prime candidates for divestiture.
Dogs are in low growth markets and have low market share. Dogs should be avoided and minimized. Expensive turn-around plans usually do not help.
For DSS, Inc. (DSS), the Commercial Lending and Direct Marketing segments clearly fit this low-growth, low-share profile based on recent performance metrics. These units consume management time and capital, contributing to the year-to-date 2025 net loss of $9.18 million.
Consider the stark revenue contribution from these two areas for fiscal year 2024:
| Business Unit | Fiscal Year 2024 Revenue | Market Position Indicator |
| Commercial Lending | $226,000 | Low Revenue/Share |
| Direct Marketing | $0 | Zero Revenue/Liability |
The Commercial Lending segment reported only $226,000 in revenue in fiscal year 2024, showing low market share and growth. Furthermore, substantial impairment in loan portfolios indicates high risk and poor returns, draining capital. This suggests that the underlying assets are not performing, which is a classic indicator of a Dog that requires difficult write-downs.
The Direct Marketing segment generated no revenue in 2024 due to a strategic shift, making it a clear low-share, low-growth liability. When a segment generates zero revenue, it represents capital and resources that are not contributing to the top line, effectively acting as a drag on the overall enterprise value.
You should look closely at the capital allocation here. These units consume management time and capital, contributing to the year-to-date 2025 net loss of $9.18 million. The core issue for these Dogs is that the cash they consume, even if minimal, is cash that cannot be deployed into the higher-potential Stars or Cash Cows within the DSS, Inc. portfolio.
- Commercial Lending revenue for FY 2024 was $226,000.
- Direct Marketing revenue for FY 2024 was $0.
- YTD 2025 net loss for DSS, Inc. was $9.18 million.
- Impairment in loan portfolios signals high credit risk.
Honestly, the path for these segments is usually clear: minimize exposure. Finance: draft a divestiture analysis for the Commercial Lending unit by next Tuesday.
DSS, Inc. (DSS) - BCG Matrix: Question Marks
You're looking at the high-risk, high-reward areas of DSS, Inc. (DSS) portfolio-the Question Marks. These are the business units operating in markets that are clearly expanding rapidly, but where DSS, Inc. hasn't yet secured a dominant position. Honestly, these are the units that keep management up at night because they demand cash now for a payoff later.
The biotechnology segment, primarily driven through its subsidiary Impact BioMedical, is a prime example of this dynamic. For the first quarter of 2025, this area demonstrated explosive top-line potential, reporting a $\mathbf{650\%}$ revenue increase compared to the prior year period. That kind of growth rate screams high market potential, but the initial revenue base was small, which is the hallmark of a Question Mark. The strategy here is clear: you need to pour resources in to capture that market before a competitor does, or you risk watching it stagnate.
The need for capital infusion to fuel this growth is evident. To support Impact BioMedical's development pipeline, DSS, Inc. executed a $\mathbf{\$1.5}$ million equity capital raise via the subsidiary during Q1 2025. This investment is necessary to push the product adoption curve up quickly. Furthermore, the company is actively managing its equity stake in this high-potential area; for instance, in June 2025, a definitive merger agreement was announced where DSS, Inc.'s interest in Impact BioMedical would convert into $\mathbf{4.80\%}$ of the combined entity's total outstanding shares post-merger. Separately, in July 2025, Impact BioMedical approved the issuance of $\mathbf{31.9}$ million shares to DSS, Inc. These actions show the company is either investing heavily or structuring for a potential exit/Star conversion.
The other area fitting this profile is the company's focus on Digital Assets and Blockchain Security. While this is a recognized high-growth market, specific revenue or market share data isn't readily available to place it precisely, but the intent is to build share in a growing space. These are the new bets that require marketing dollars to gain buyer discovery and adoption.
Here's a quick look at the financial pressure these high-growth, low-share units are putting on the overall enterprise as of the nine-month period ended September 30, 2025:
| Financial Metric | Value (YTD 2025) |
| Net Cash Used in Operations (Cash Burn) | $\mathbf{\$7.58}$ million |
| Net Cash Used in Operations (Q1 2024) | $\mathbf{\$2.15}$ million |
| Net Cash Used in Operations (Q1 2025) | $\mathbf{\$1.64}$ million |
The $\mathbf{\$7.58}$ million in net cash used in operations year-to-date 2025 highlights the significant cash drain. You see, Question Marks lose the company money in the near term because the investment outpaces the current low return from their small market share. The management team has explicitly noted that the recurring losses and this cash burn raise substantial doubt about continuing as a going concern without one of these high-potential units successfully converting into a Star. It's a classic high-stakes gamble.
The strategic imperative for these segments is clear:
- Invest Heavily: Allocate capital to rapidly increase market share, aiming for Star status.
- Divest: Sell the unit if the path to significant market penetration is blocked or too costly.
- High Demand, Low Return: These units currently consume cash but have the potential for high future returns.
The company's Q1 2025 total revenue growth of $\mathbf{28\%}$ suggests some of the strategy is working, but the overall cash position remains tight, with current liabilities of $\mathbf{\$54.19}$ million against only $\mathbf{\$7.02}$ million in cash at September 30, 2025. Finance: draft the 13-week cash view by Friday, focusing on the capital needs of Impact BioMedical.
Disclaimer
All information, articles, and product details provided on this website are for general informational and educational purposes only. We do not claim any ownership over, nor do we intend to infringe upon, any trademarks, copyrights, logos, brand names, or other intellectual property mentioned or depicted on this site. Such intellectual property remains the property of its respective owners, and any references here are made solely for identification or informational purposes, without implying any affiliation, endorsement, or partnership.
We make no representations or warranties, express or implied, regarding the accuracy, completeness, or suitability of any content or products presented. Nothing on this website should be construed as legal, tax, investment, financial, medical, or other professional advice. In addition, no part of this site—including articles or product references—constitutes a solicitation, recommendation, endorsement, advertisement, or offer to buy or sell any securities, franchises, or other financial instruments, particularly in jurisdictions where such activity would be unlawful.
All content is of a general nature and may not address the specific circumstances of any individual or entity. It is not a substitute for professional advice or services. Any actions you take based on the information provided here are strictly at your own risk. You accept full responsibility for any decisions or outcomes arising from your use of this website and agree to release us from any liability in connection with your use of, or reliance upon, the content or products found herein.