
|
DTE Energy Company (DTE): BCG Matrix [Apr-2026 Updated] |
Fully Editable: Tailor To Your Needs In Excel Or Sheets
Professional Design: Trusted, Industry-Standard Templates
Investor-Approved Valuation Models
MAC/PC Compatible, Fully Unlocked
No Expertise Is Needed; Easy To Follow
DTE Energy Company (DTE) Bundle
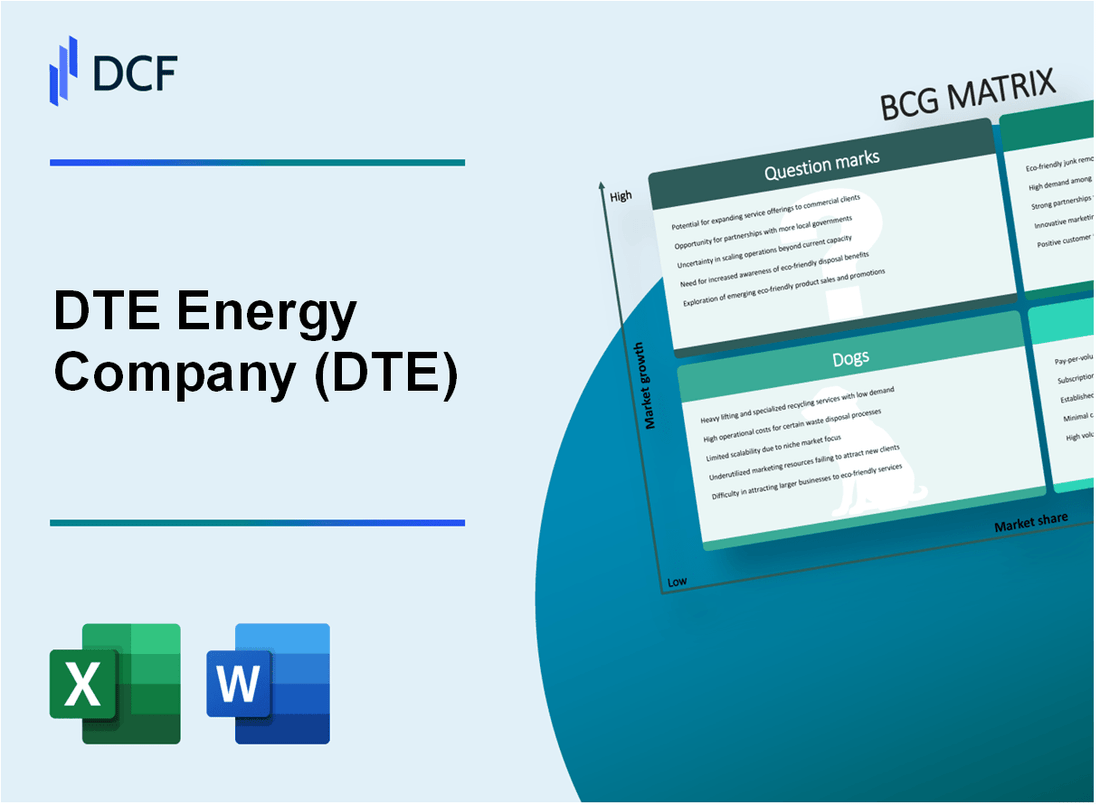
You're trying to map out DTE Energy Company's next decade, and frankly, their $30 billion capital plan for 2025-2029 makes the Boston Consulting Group Matrix analysis surprisingly direct. We see the regulated utility as the bedrock Cash Cow, reliably kicking in about 90% of operating earnings to fund the high-growth Stars-that's the massive grid modernization and the new 1.4 GW hyperscale data center load. Still, this transformation means shedding Dogs like legacy coal generation, which must retire by 2035, while balancing Question Marks such as Renewable Natural Gas projects that face legislative risk after 2027. Read on to see the precise breakdown of where DTE Energy Company is putting its money to work.
Background of DTE Energy Company (DTE)
DTE Energy Company (DTE) is a major energy provider headquartered in Detroit, Michigan. You'll find its stock trading on the NYSE. As of late 2025, the company's structure centers on its regulated utility operations, which provide the bulk of its stability. Specifically, DTE operates an electric company that serves about 2.3 million customers across Southeast Michigan, and a natural gas company serving approximately 1.3 million customers throughout the state.
Beyond the core regulated utilities, DTE Energy Company maintains a portfolio of energy-related businesses. These include units focused on custom energy solutions, energy marketing and trading, and renewable energy generation. For the three months ending September 30, 2025, DTE Energy Company reported operating revenues of $3,527 million, contributing to a trailing twelve months (TTM) revenue of $14.82 Billion USD.
The company is heavily engaged in a long-term strategic pivot toward cleaner energy and grid modernization. DTE Energy Company confirmed its full-year 2025 operating earnings per share (EPS) guidance to be in the range of $7.09 to $7.23. This strategy is backed by an ambitious $30 billion capital investment plan slated to run from 2025 through 2029, with significant spending directed toward the electric business and renewable infrastructure.
Financially, DTE Energy Company is navigating this transition while managing its leverage; its debt-to-equity ratio was reported at 1.97. The company projected operating cash flow of $3.3 billion for 2025 to help fund capital expenditures, which included an investment of nearly $3 billion into its utilities through the third quarter of 2025 alone. This focus on infrastructure is aimed at long-term resilience, building on prior successes like reporting a nearly 70% reduction in customers' time without power in 2024.
DTE Energy Company (DTE) - BCG Matrix: Stars
You're looking at the engine room of DTE Energy Company's future growth, and that's where the Stars live. These aren't just stable operations; these are the business units capturing massive, mandated, and newly created high-growth markets, demanding huge capital outlays to maintain leadership. For DTE Energy Company, the Star quadrant is dominated by its regulated electric utility business, specifically its aggressive push into grid modernization and capturing new, high-density load like hyperscale data centers.
The sheer scale of the required investment solidifies this segment's Star status. DTE Energy Company has now expanded its five-year capital expenditure plan to a total of $36.5 billion, up $6.5 billion from its previous projection. This isn't just maintenance; it's building the future grid. The electric business is set to absorb $30 billion of this revised total, underscoring where the growth-and the cash burn-is concentrated.
The regulated electric utility's commitment to the future is quantified by its $30 billion five-year capital plan, which is heavily weighted toward electric infrastructure. In the first half of 2025 alone, DTE Energy Company invested $1.8 billion under this umbrella. This spending is directly tied to meeting Michigan's 100% clean energy mandate by 2040 and ensuring the grid can handle the next wave of demand.
The data center contracts are the clearest indicator of high market share in a rapidly growing sub-market. DTE Energy Company has executed a landmark 1.4 GW agreement with a hyperscaler, a deal that represents a 25% increase in the utility's overall load as it ramps up over the next two to three years. Honestly, this single deal validates their market position for these massive new energy users. Furthermore, DTE Energy Company is in late-stage negotiations for an additional 3 GW of data center load, with a total pipeline that could reach 7 GW.
To support this growth and the clean energy transition, DTE Energy Company is deploying capital across specific, high-growth infrastructure projects. Here's a look at the planned renewable deployment targets within the current capital plan:
- Targeted Solar Deployment by 2029: 3,200 MW
- Targeted Wind Capacity by 2029: 1,000 MW
- Targeted Battery Storage by 2029: 430 MW
The aggressive renewable energy deployment is a direct response to regulatory mandates, which create guaranteed, high-growth demand for DTE Energy Company's assets. The utility expects to meet Michigan's 50% renewable energy goal by 2030. To achieve this, DTE Energy Company plans to invest an additional $4 billion over the next several years, building approximately 900 MW of renewables per year on average over the next five years.
The high-growth capital investment in electric infrastructure is the primary cash consumer, which is typical for a Star. This focus is designed to secure future revenue streams through rate base growth and regulatory recovery mechanisms. The commitment to grid resilience is also a key component of this Star segment:
| Metric | Value/Target | Context |
| Total 5-Year Capex (Revised) | $36.5 billion | Total investment through 2030, up $6.5 billion. |
| Electric Business Allocation | $30 billion | The majority of the capital plan, supporting Stars. |
| Grid Upgrade Investment Target (by 2029) | $10 billion | Specific spend to improve reliability. |
| Outage Duration Reduction Target (by 2029) | 30% | Reliability improvement goal. |
| Infrastructure Recovery Mechanism (IRM) Peak | $1 billion | Annual recovery amount targeted by 2029. |
The terms of the new hyperscale deal are structured to mitigate immediate cash strain while locking in long-term revenue. The 1.4 GW agreement includes a 19-year power-supply contract with minimum monthly charges. Plus, the customer will fund its own storage needs, requiring DTE Energy Company to build and operate about 1.4 GW of energy storage capacity under a 15-year contract, paid for by the customer.
This massive capital deployment is expected to translate directly into earnings growth, which is the key to these Stars eventually becoming Cash Cows. DTE Energy Company has projected that the 1.4 GW agreement alone will help drive 6 to 8% annual growth in earnings per share through 2030. If DTE Energy Company sustains this success in capturing high-growth load and executes its clean energy build-out, the regulated electric utility will transition into a powerful Cash Cow as the market growth rate inevitably slows down.
DTE Energy Company (DTE) - BCG Matrix: Cash Cows
The core regulated utility operations, DTE Electric and DTE Gas, represent the quintessential Cash Cow segment for DTE Energy Company. These businesses operate in a mature, regulated market where high market share is essentially guaranteed by service territory exclusivity, leading to stable, predictable returns. The scale of investment into these units underscores their central role; for instance, in 2024, DTE Electric invested over $$2.5$ billion in infrastructure improvements and $$1.1$ billion in cleaner generation, while DTE Gas invested $$740$ million to upgrade its system.
This segment is the primary engine for funding the company's long-term strategy. The stability is rooted in the constructive regulatory environment in Michigan, which allows for the recovery of prudent capital investments. You see this mechanism in action through the Infrastructure Recovery Mechanism (IRM), which is set to expand from $$290$ million in 2025 to $$1$ billion by 2029, ensuring cost recovery for grid upgrades. The regulated earnings visibility supports the reaffirmed full-year 2025 operating EPS guidance range of $$7.09$ to $$7.23$.
| Metric | Value/Range | Year/Period |
| Projected Operating Cash Flow | $$3.3$ billion | 2025 |
| Total Projected Utility Investment (Capex) | $$4.4$ billion | 2025 |
| 2025 Electric Rate Case Seeking Increase | $$574$ million | 2025 |
| IRM Allocation (Start of Period) | $$290$ million | 2025 |
| 2025 Operating EPS Guidance Midpoint | $\sim$7.16$ | 2025 |
The predictable revenue stream is directly supported by regulatory approvals that allow DTE Energy Company to grow its rate base to support massive infrastructure spending. The 2025 Electric Rate Case, for example, seeks a $$574$ million increase alongside a $\mathbf{10.75\%}$ return on equity, which is vital for recovering the capital deployed into grid modernization. These regulated assets generate the necessary cash flow to sustain operations and fund growth initiatives elsewhere in the portfolio. The company is on track to invest a total of $$4.4$ billion into its utilities in 2025.
This business unit generates the operating cash flow required to support the broader enterprise. The operating cash flow is projected at around $$3.3$ billion in 2025, which must cover a significant portion of the total $$30$ billion capital expenditure plan slated through 2029. This cash generation is the lifeblood that allows DTE Energy Company to fund its massive capex program without relying solely on external financing, which is a key advantage of a strong Cash Cow position. The utility operations are the source of funds that help turn Question Marks into future Stars.
- Core operations provide stable, regulated returns.
- Cash flow funds the $$30$ billion capex plan (2025-2029).
- Regulatory mechanisms ensure cost recovery for investments.
- Focus is on maintaining current productivity levels.
DTE Energy Company (DTE) - BCG Matrix: Dogs
You're looking at the parts of DTE Energy Company that are tying up capital without delivering stellar returns, the classic Dogs quadrant. These are units in low-growth areas or those with low market share that management needs to carefully manage or divest. Here's the breakdown of the specific areas fitting this profile as of late 2025.
Legacy Coal-Fired Generation Assets
The accelerated retirement schedule for legacy coal assets, while necessary for the clean energy transition, represents a significant sunk cost and a drag on future capital allocation until fully retired. The plan, as approved by the Michigan Public Service Commission (MPSC), is to end DTE Energy Company's use of coal by 2035.
Specifically, the 3,066-MW, coal-fired Monroe power plant has a phased retirement. Two units are scheduled to shutter by the end of 2028, and the remaining two units by the end of 2032, though the overall goal is 2035 for all coal use. Furthermore, the two units at the Belle River coal-fired plant are slated for conversion to gas-fired peakers in 2025 and 2026. To manage the transition, DTE Energy Company will be able to securitize about $1 billion in its coal plant assets. These assets are low-growth by definition and require expensive, mandated turn-around (decommissioning/conversion) plans.
The Energy Trading Segment
The Energy Trading segment is a source of near-term earnings noise, which is typical for merchant-exposed businesses that don't fit neatly into the regulated utility structure. While it can produce strong results, its volatility makes it a Dog candidate due to the low predictability it injects into overall earnings.
For instance, in the third quarter of 2025, Energy Trading earned $23 million in operating earnings. This contrasts with the first quarter of 2025, where the segment earned $34 million, though that figure was influenced by a $31 million favorable tax timing effect that was expected to reverse later in the year. The second quarter 2025 results showed a miss that management attributed to 'short-term earnings noise driven by merchant exposures.' The year-to-date performance through Q3 2025 was reportedly 'above the high end of operating earnings guidance for this segment,' but the inherent market exposure keeps it in the low-share/low-certainty category for long-term strategic planning.
Older Distribution Infrastructure
The need to maintain older distribution infrastructure represents a significant, non-growth-oriented cash drain, even if it is essential for reliability. This is a classic Dog characteristic: consuming cash just to stay operational.
DTE Energy Company is on track to invest a total of $4.4 billion into its utilities in 2025, with a substantial portion dedicated to upgrading and modernizing electric and natural gas infrastructure to maintain reliability. This investment is part of a larger $30 billion five-year capital expenditure plan running from 2025-2029. The focus on maintaining existing assets, rather than purely expanding into new, high-growth regulated markets, places this category firmly in the Dog quadrant, requiring substantial capital just to maintain the status quo.
Here are the key investment figures related to infrastructure maintenance and modernization:
| Metric | Value (2025) | Purpose |
| Total 2025 Utility Investment | $4.4 billion | Improve safety and reliability of electric and natural gas infrastructure. |
| Investment Through Q3 2025 | Nearly $3 billion | Execution pace on the 2025 capital plan. |
| 5-Year Capex Plan (2025-2029) | $30 billion | Overall capital commitment including clean energy and infrastructure. |
DTE Gas Segment
The DTE Gas segment showed clear signs of being a cash consumer in the third quarter of 2025 due to rising internal costs, fitting the profile of a Dog that is actively consuming cash rather than breaking even.
The segment reported unfavorable operating earnings in Q3 2025. You saw an operating loss of $38 million for that quarter. This result was $25 million lower (unfavorable) compared to the third quarter of 2024. The primary driver for this negative variance was explicitly cited as higher O&M (Operations & Maintenance) and rate-base costs. On a per-share basis, the segment recorded a loss of 18 cents per share in Q3 2025, worsening from a loss of 6 cents per share in the year-ago period. This segment requires active management to stop the cash drain caused by escalating operating expenses.
Segmental Financial Performance Comparison (Q3 2025 vs. Q3 2024):
- DTE Gas Operating Earnings Variance: -$25 million unfavorable.
- DTE Gas Q3 2025 Operating Loss: $38 million.
- DTE Gas Q3 2025 Loss Per Share: $0.18.
- Primary Driver: Higher O&M and rate-base costs.
Finance: draft a sensitivity analysis on the impact of a further 5% rise in O&M costs for DTE Gas by end of Q1 2026 by next Tuesday.
DTE Energy Company (DTE) - BCG Matrix: Question Marks
These business units operate in high-growth markets but currently hold a low market share, meaning they consume significant cash to fuel expansion while generating limited immediate returns. For DTE Energy, these areas represent potential future Stars that require focused capital deployment.
DTE Vantage (Non-Utility Power & Industrial) Segment
The DTE Vantage segment, representing non-utility power and industrial solutions, is a clear example of a high-growth area within DTE Energy's portfolio. This segment more than doubled its contribution in the second quarter of 2025, achieving operating earnings of $31 million. This represented a year-over-year increase of $17 million for the quarter. While this growth is promising, the segment remains smaller relative to the core utility business, fitting the low market share profile of a Question Mark. The strategy here involves heavy investment to quickly scale this segment's market penetration.
Renewable Natural Gas (RNG) Projects
DTE Energy's Renewable Natural Gas (RNG) projects benefit directly from the high-growth trend toward decarbonization and renewable fuels. The financial viability of these projects is currently bolstered by federal incentives. Management expressed confidence in achieving the high end of its 2025 operating EPS guidance range due to the inclusion of 45Z production tax credits from these RNG projects, projecting this favorability through 2027. However, the core risk here is legislative; the market adoption strategy is highly sensitive to the sunset risk for the 45Z tax credits, which the market is watching closely, especially given legislative discussions that could alter their availability after 2027.
New Technologies: Utility-Scale Battery Storage
Investments in new technologies, particularly utility-scale battery storage, are cash-intensive upfront but essential for grid modernization and supporting intermittent renewable sources. The Slocum Energy Center, which began operations in Trenton in February 2025, serves as a pilot for this category.
Here are key specifications for this new asset:
- Capacity: 14 megawatt.
- Duration: 4-hour duration Lithium-ion system.
- Purpose: Replaced six decades of diesel engine service at the Slocum station site.
- Future Goal: DTE plans for more than 2,900 megawatts of energy storage by 2042.
The overall 2025 utility investment pace is set at $4.4 billion, following an investment of over $850 million in the first quarter alone. This high initial capital outlay characterizes these technology bets as Question Marks.
Incremental Investment Tied to Data Center Opportunities
The most significant potential cash consumption and growth opportunity lies in investments tied to unapproved data center opportunities, which could necessitate incremental capital expenditure above the base plan. DTE Energy has an existing five-year capital plan through 2030 totaling $30 billion, which already included a $6.5 billion increase driven by early data center agreements.
The current situation regarding these high-growth, low-share opportunities can be summarized as follows:
| Metric | Value | Context |
|---|---|---|
| Secured Data Center Load | 1.4 GW | Finalized agreement with a hyperscaler. |
| Total Data Center Pipeline | Up to 8.4 GW | Total potential load DTE is planning infrastructure for. |
| Base Capital Plan (2026-2030) | $30 billion | The established five-year investment framework. |
| Incremental Investment Potential | Above $30 billion | Dependent on advancing negotiations for additional data center load. |
| 2025 Operating EPS Guidance | $7.09 to $7.23 | Guidance reaffirmed despite regulatory scrutiny on new contracts. |
The necessity to fund generation and distribution infrastructure for the secured 1.4 GW load, plus the potential for an additional 3 GW under negotiation, forces DTE Energy to consider capital spending that could exceed the current $30 billion plan, making these unapproved opportunities prime Question Marks requiring immediate investment decisions.
Disclaimer
All information, articles, and product details provided on this website are for general informational and educational purposes only. We do not claim any ownership over, nor do we intend to infringe upon, any trademarks, copyrights, logos, brand names, or other intellectual property mentioned or depicted on this site. Such intellectual property remains the property of its respective owners, and any references here are made solely for identification or informational purposes, without implying any affiliation, endorsement, or partnership.
We make no representations or warranties, express or implied, regarding the accuracy, completeness, or suitability of any content or products presented. Nothing on this website should be construed as legal, tax, investment, financial, medical, or other professional advice. In addition, no part of this site—including articles or product references—constitutes a solicitation, recommendation, endorsement, advertisement, or offer to buy or sell any securities, franchises, or other financial instruments, particularly in jurisdictions where such activity would be unlawful.
All content is of a general nature and may not address the specific circumstances of any individual or entity. It is not a substitute for professional advice or services. Any actions you take based on the information provided here are strictly at your own risk. You accept full responsibility for any decisions or outcomes arising from your use of this website and agree to release us from any liability in connection with your use of, or reliance upon, the content or products found herein.