
|
Fangdd Network Group Ltd. (DUO) DCF Valuation |
Fully Editable: Tailor To Your Needs In Excel Or Sheets
Professional Design: Trusted, Industry-Standard Templates
Investor-Approved Valuation Models
MAC/PC Compatible, Fully Unlocked
No Expertise Is Needed; Easy To Follow
Fangdd Network Group Ltd. (DUO) Bundle
Discover the true value of Fangdd Network Group Ltd. (DUO) with our professional-grade DCF Calculator! Adjust key assumptions, explore various scenarios, and assess how changes affect Fangdd's valuation – all within a single Excel template.
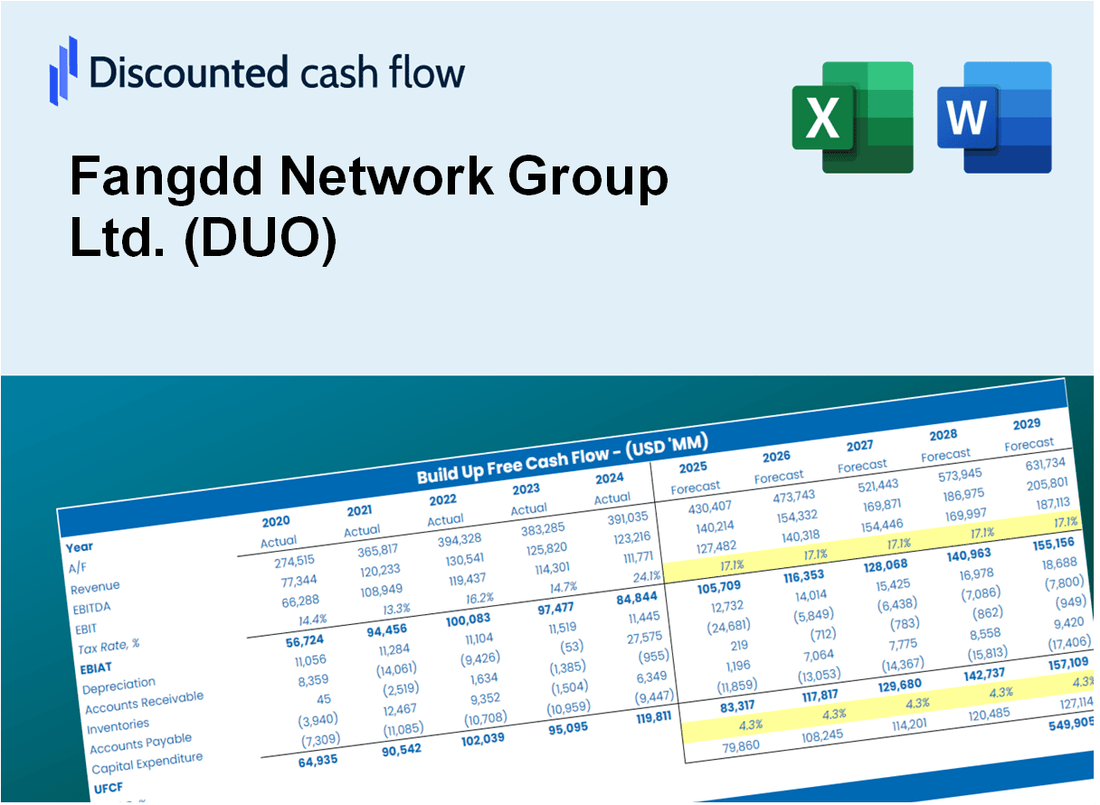
Discounted Cash Flow (DCF) - (USD MM)
| Year | AY1 2020 |
AY2 2021 |
AY3 2022 |
AY4 2023 |
AY5 2024 |
FY1 2025 |
FY2 2026 |
FY3 2027 |
FY4 2028 |
FY5 2029 |
|---|---|---|---|---|---|---|---|---|---|---|
| Revenue | 344.3 | 132.3 | 34.5 | 40.0 | 47.6 | 35.6 | 26.7 | 20.0 | 14.9 | 11.2 |
| Revenue Growth, % | 0 | -61.56 | -73.9 | 15.86 | 19 | -25.15 | -25.15 | -25.15 | -25.15 | -25.15 |
| EBITDA | -26.7 | -133.4 | -31.4 | -13.0 | -17.4 | -19.1 | -14.3 | -10.7 | -8.0 | -6.0 |
| EBITDA, % | -7.75 | -100.77 | -90.92 | -32.48 | -36.56 | -53.54 | -53.54 | -53.54 | -53.54 | -53.54 |
| Depreciation | .5 | 1.1 | .5 | .3 | .2 | .2 | .2 | .1 | .1 | .1 |
| Depreciation, % | 0.15425 | 0.81655 | 1.36 | 0.63694 | 0.46357 | 0.68595 | 0.68595 | 0.68595 | 0.68595 | 0.68595 |
| EBIT | -27.2 | -134.4 | -31.9 | -13.3 | -17.6 | -19.3 | -14.4 | -10.8 | -8.1 | -6.0 |
| EBIT, % | -7.9 | -101.58 | -92.28 | -33.12 | -37.03 | -54.07 | -54.07 | -54.07 | -54.07 | -54.07 |
| Total Cash | 119.7 | 70.0 | 20.5 | 19.2 | 26.5 | 17.9 | 13.4 | 10.0 | 7.5 | 5.6 |
| Total Cash, percent | .0 | .0 | .0 | .0 | .0 | .0 | .0 | .0 | .0 | .0 |
| Account Receivables | 329.2 | 137.8 | 79.3 | 58.7 | 44.1 | 34.8 | 26.1 | 19.5 | 14.6 | 10.9 |
| Account Receivables, % | 95.63 | 104.14 | 229.46 | 146.75 | 92.63 | 97.65 | 97.65 | 97.65 | 97.65 | 97.65 |
| Inventories | .0 | .0 | 1.6 | 1.8 | .8 | .7 | .6 | .4 | .3 | .2 |
| Inventories, % | 0 | 0 | 4.54 | 4.39 | 1.59 | 2.1 | 2.1 | 2.1 | 2.1 | 2.1 |
| Accounts Payable | 252.3 | 165.1 | 92.6 | 55.5 | 25.4 | 30.4 | 22.8 | 17.0 | 12.8 | 9.5 |
| Accounts Payable, % | 73.28 | 124.78 | 268.03 | 138.77 | 53.3 | 85.32 | 85.32 | 85.32 | 85.32 | 85.32 |
| Capital Expenditure | -1.4 | -1.7 | .0 | .0 | -4.4 | -.8 | -.6 | -.4 | -.3 | -.2 |
| Capital Expenditure, % | -0.41807 | -1.32 | -0.07887846 | -0.10388 | -9.21 | -2.23 | -2.23 | -2.23 | -2.23 | -2.23 |
| Tax Rate, % | -49.33 | -49.33 | -49.33 | -49.33 | -49.33 | -49.33 | -49.33 | -49.33 | -49.33 | -49.33 |
| EBITAT | -29.1 | -131.9 | -33.5 | -12.8 | -26.3 | -19.1 | -14.3 | -10.7 | -8.0 | -6.0 |
| Depreciation | ||||||||||
| Changes in Account Receivables | ||||||||||
| Changes in Inventories | ||||||||||
| Changes in Accounts Payable | ||||||||||
| Capital Expenditure | ||||||||||
| UFCF | -107.0 | -28.3 | -48.6 | -29.3 | -45.0 | -5.3 | -13.4 | -10.0 | -7.5 | -5.6 |
| WACC, % | 16.76 | 16.76 | 16.76 | 16.76 | 16.76 | 16.76 | 16.76 | 16.76 | 16.76 | 16.76 |
| PV UFCF | ||||||||||
| SUM PV UFCF | -27.3 | |||||||||
| Long Term Growth Rate, % | 2.00 | |||||||||
| Free cash flow (T + 1) | -6 | |||||||||
| Terminal Value | -39 | |||||||||
| Present Terminal Value | -18 | |||||||||
| Enterprise Value | -45 | |||||||||
| Net Debt | -10 | |||||||||
| Equity Value | -35 | |||||||||
| Diluted Shares Outstanding, MM | 9 | |||||||||
| Equity Value Per Share | -3.89 |
What You Will Receive
- Customizable Excel Template: A fully adjustable Excel-based DCF Calculator featuring pre-filled real DUO financials.
- Authentic Data: Historical performance data and forward-looking projections (highlighted in the yellow cells).
- Flexible Forecasting: Adjust forecast parameters such as revenue growth, EBITDA %, and WACC.
- Instant Calculations: Quickly observe how your inputs influence Fangdd Network Group Ltd.'s valuation.
- Professional Resource: Designed for investors, CFOs, consultants, and financial analysts.
- User-Centric Layout: Organized for clarity and simplicity, complete with step-by-step guidance.
Key Features
- 🔍 Real-Life DUO Financials: Pre-filled historical and projected data for Fangdd Network Group Ltd.
- ✏️ Fully Customizable Inputs: Adjust all critical parameters (yellow cells) like WACC, growth %, and tax rates.
- 📊 Professional DCF Valuation: Built-in formulas calculate Fangdd’s intrinsic value using the Discounted Cash Flow method.
- ⚡ Instant Results: Visualize Fangdd’s valuation instantly after making changes.
- Scenario Analysis: Test and compare outcomes for various financial assumptions side-by-side.
How It Works
- Step 1: Download the prebuilt Excel template featuring Fangdd Network Group Ltd. (DUO) data.
- Step 2: Review the pre-filled sheets to grasp the essential metrics.
- Step 3: Modify forecasts and assumptions in the editable yellow cells (WACC, growth, margins).
- Step 4: Instantly see recalculated results, including Fangdd Network Group Ltd.'s (DUO) intrinsic value.
- Step 5: Make well-informed investment decisions or create reports based on the outputs.
Why Choose This Calculator for Fangdd Network Group Ltd. (DUO)?
- Designed for Experts: A sophisticated tool tailored for analysts, CFOs, and financial consultants.
- Accurate Financial Data: Fangdd’s historical and forecasted financials are preloaded for precision.
- Flexible Scenario Analysis: Effortlessly simulate various forecasts and assumptions.
- Comprehensive Outputs: Automatically computes intrinsic value, NPV, and essential metrics.
- User-Friendly: Step-by-step guidance makes the process straightforward.
Who Should Use Fangdd Network Group Ltd. (DUO)?
- Investors: Gain insights and make informed decisions with our advanced market analysis tools.
- Financial Analysts: Streamline your workflow with customizable financial models tailored for DUO.
- Consultants: Effortlessly modify templates for impactful client presentations and reports.
- Finance Enthusiasts: Enhance your knowledge of the real estate market with practical examples from DUO.
- Educators and Students: Utilize our resources as a hands-on learning tool in real estate and finance courses.
What the Template Contains
- Preloaded DUO Data: Historical and projected financial data, including revenue, EBIT, and capital expenditures.
- DCF and WACC Models: Professional-grade sheets for calculating intrinsic value and Weighted Average Cost of Capital.
- Editable Inputs: Yellow-highlighted cells for adjusting revenue growth, tax rates, and discount rates.
- Financial Statements: Comprehensive annual and quarterly financials for deeper analysis.
- Key Ratios: Profitability, leverage, and efficiency ratios to evaluate performance.
- Dashboard and Charts: Visual summaries of valuation outcomes and assumptions.
Disclaimer
All information, articles, and product details provided on this website are for general informational and educational purposes only. We do not claim any ownership over, nor do we intend to infringe upon, any trademarks, copyrights, logos, brand names, or other intellectual property mentioned or depicted on this site. Such intellectual property remains the property of its respective owners, and any references here are made solely for identification or informational purposes, without implying any affiliation, endorsement, or partnership.
We make no representations or warranties, express or implied, regarding the accuracy, completeness, or suitability of any content or products presented. Nothing on this website should be construed as legal, tax, investment, financial, medical, or other professional advice. In addition, no part of this site—including articles or product references—constitutes a solicitation, recommendation, endorsement, advertisement, or offer to buy or sell any securities, franchises, or other financial instruments, particularly in jurisdictions where such activity would be unlawful.
All content is of a general nature and may not address the specific circumstances of any individual or entity. It is not a substitute for professional advice or services. Any actions you take based on the information provided here are strictly at your own risk. You accept full responsibility for any decisions or outcomes arising from your use of this website and agree to release us from any liability in connection with your use of, or reliance upon, the content or products found herein.