
|
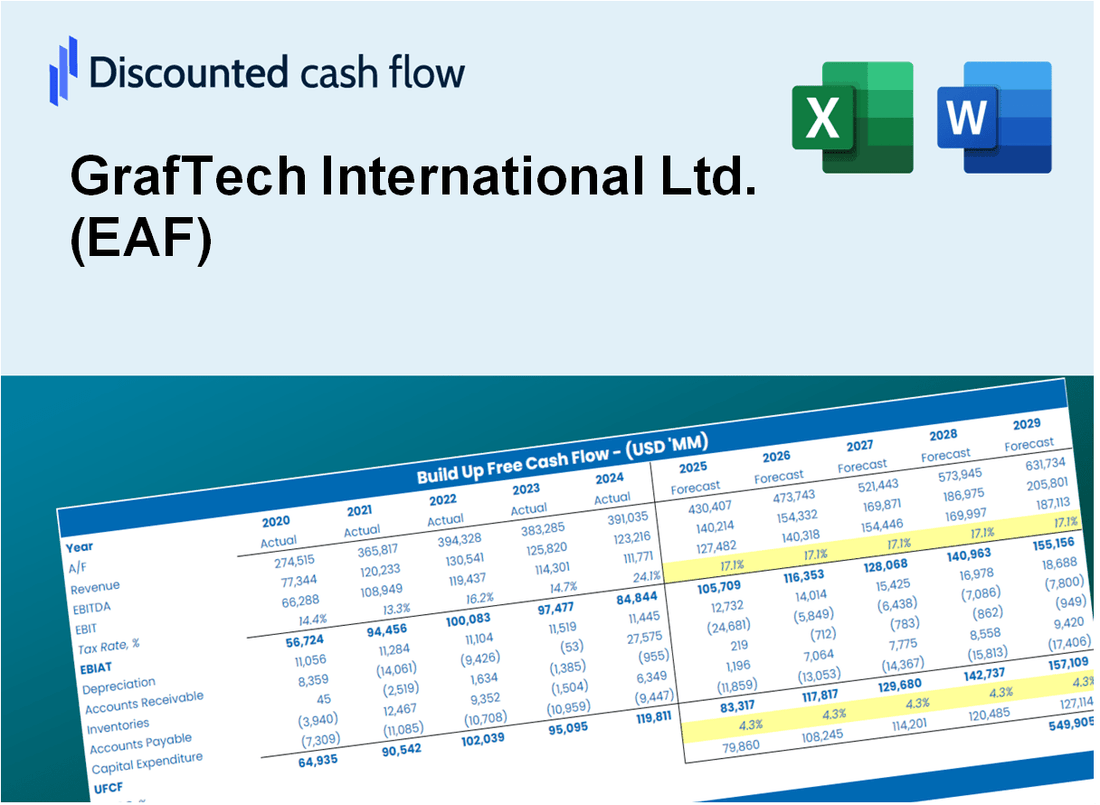
GrafTech International Ltd. (EAF) DCF Valuation |
Fully Editable: Tailor To Your Needs In Excel Or Sheets
Professional Design: Trusted, Industry-Standard Templates
Investor-Approved Valuation Models
MAC/PC Compatible, Fully Unlocked
No Expertise Is Needed; Easy To Follow
GrafTech International Ltd. (EAF) Bundle
Looking to calculate the intrinsic value of GrafTech International Ltd.? Our EAF DCF Calculator integrates real-world data with extensive customization options, enabling you to adjust forecasts and enhance your investment strategies.
Discounted Cash Flow (DCF) - (USD MM)
| Year | AY1 2020 |
AY2 2021 |
AY3 2022 |
AY4 2023 |
AY5 2024 |
FY1 2025 |
FY2 2026 |
FY3 2027 |
FY4 2028 |
FY5 2029 |
|---|---|---|---|---|---|---|---|---|---|---|
| Revenue | 1,224.4 | 1,345.8 | 1,281.3 | 620.5 | 538.8 | 458.5 | 390.1 | 332.0 | 282.5 | 240.4 |
| Revenue Growth, % | 0 | 9.92 | -4.8 | -51.57 | -13.17 | -14.9 | -14.9 | -14.9 | -14.9 | -14.9 |
| EBITDA | 666.7 | 589.0 | 546.8 | -145.2 | 1.7 | 108.0 | 91.9 | 78.2 | 66.6 | 56.6 |
| EBITDA, % | 54.45 | 43.77 | 42.68 | -23.4 | 0.3107 | 23.56 | 23.56 | 23.56 | 23.56 | 23.56 |
| Depreciation | 63.0 | 65.7 | 55.5 | 56.9 | 62.2 | 32.2 | 27.4 | 23.3 | 19.8 | 16.9 |
| Depreciation, % | 5.14 | 4.88 | 4.33 | 9.17 | 11.55 | 7.02 | 7.02 | 7.02 | 7.02 | 7.02 |
| EBIT | 603.7 | 523.3 | 491.3 | -202.1 | -60.6 | 75.9 | 64.6 | 54.9 | 46.7 | 39.8 |
| EBIT, % | 49.31 | 38.89 | 38.35 | -32.57 | -11.24 | 16.55 | 16.55 | 16.55 | 16.55 | 16.55 |
| Total Cash | 145.4 | 57.5 | 134.6 | 176.9 | 256.2 | 94.2 | 80.2 | 68.2 | 58.0 | 49.4 |
| Total Cash, percent | .0 | .0 | .0 | .0 | .0 | .0 | .0 | .0 | .0 | .0 |
| Account Receivables | 194.8 | 249.6 | 185.0 | 130.0 | 115.5 | 83.7 | 71.2 | 60.6 | 51.6 | 43.9 |
| Account Receivables, % | 15.91 | 18.55 | 14.44 | 20.95 | 21.44 | 18.26 | 18.26 | 18.26 | 18.26 | 18.26 |
| Inventories | 277.8 | 301.8 | 447.7 | 345.4 | 245.4 | 166.2 | 141.4 | 120.4 | 102.4 | 87.2 |
| Inventories, % | 22.69 | 22.43 | 34.95 | 55.66 | 45.55 | 36.26 | 36.26 | 36.26 | 36.26 | 36.26 |
| Accounts Payable | 71.0 | 117.1 | 103.2 | 83.3 | 72.8 | 45.4 | 38.6 | 32.9 | 28.0 | 23.8 |
| Accounts Payable, % | 5.8 | 8.7 | 8.05 | 13.42 | 13.52 | 9.9 | 9.9 | 9.9 | 9.9 | 9.9 |
| Capital Expenditure | -36.1 | -58.3 | -72.2 | -54.0 | -34.3 | -25.7 | -21.8 | -18.6 | -15.8 | -13.5 |
| Capital Expenditure, % | -2.95 | -4.33 | -5.63 | -8.71 | -6.37 | -5.6 | -5.6 | -5.6 | -5.6 | -5.6 |
| Tax Rate, % | 14.42 | 14.42 | 14.42 | 14.42 | 14.42 | 14.42 | 14.42 | 14.42 | 14.42 | 14.42 |
| EBITAT | 514.2 | 445.3 | 416.0 | -188.4 | -51.8 | 65.8 | 56.0 | 47.7 | 40.5 | 34.5 |
| Depreciation | ||||||||||
| Changes in Account Receivables | ||||||||||
| Changes in Inventories | ||||||||||
| Changes in Accounts Payable | ||||||||||
| Capital Expenditure | ||||||||||
| UFCF | 139.4 | 420.0 | 304.1 | -48.1 | 80.1 | 155.9 | 92.0 | 78.3 | 66.6 | 56.7 |
| WACC, % | 10.74 | 10.74 | 10.73 | 10.9 | 10.75 | 10.77 | 10.77 | 10.77 | 10.77 | 10.77 |
| PV UFCF | ||||||||||
| SUM PV UFCF | 351.6 | |||||||||
| Long Term Growth Rate, % | 0.50 | |||||||||
| Free cash flow (T + 1) | 57 | |||||||||
| Terminal Value | 555 | |||||||||
| Present Terminal Value | 333 | |||||||||
| Enterprise Value | 684 | |||||||||
| Net Debt | 831 | |||||||||
| Equity Value | -146 | |||||||||
| Diluted Shares Outstanding, MM | 258 | |||||||||
| Equity Value Per Share | -0.57 |
What You Will Receive
- Comprehensive Financial Model: GrafTech’s actual data facilitates accurate DCF valuation.
- Complete Forecast Flexibility: Modify revenue growth, profit margins, WACC, and other essential factors.
- Real-Time Calculations: Automatic updates provide immediate feedback as you adjust inputs.
- Professional-Grade Template: A polished Excel file crafted for high-quality valuation presentations.
- Adaptable and Reusable: Designed for versatility, allowing repeated application for in-depth forecasts.
Key Features
- Customizable Financial Inputs: Adjust essential parameters such as production capacity, cost of goods sold, and operational expenses.
- Instant DCF Valuation: Automatically computes intrinsic value, NPV, and additional financial metrics.
- Industry-Leading Precision: Leverages GrafTech's actual financial data for accurate valuation results.
- Effortless Scenario Testing: Evaluate various assumptions and analyze results with ease.
- Efficiency Booster: Streamline the valuation process without the hassle of creating intricate models from the ground up.
How It Works
- Step 1: Download the Excel file.
- Step 2: Review GrafTech International Ltd.'s pre-filled financial data and forecasts.
- Step 3: Modify key inputs such as revenue growth, WACC, and tax rates (highlighted cells).
- Step 4: Observe the DCF model update in real-time as you adjust your assumptions.
- Step 5: Analyze the outputs and utilize the results for your investment choices.
Why Choose This Calculator for GrafTech International Ltd. (EAF)?
- Precise Financials: Utilize accurate GrafTech financial data for trustworthy valuation outcomes.
- Flexible Options: Tailor crucial parameters such as growth rates, WACC, and tax rates to fit your forecasts.
- Efficiency Boost: Ready-to-use calculations save you from starting from the ground up.
- Expert-Level Resource: Crafted for investors, analysts, and consultants in the field.
- Easy to Navigate: User-friendly design and clear, step-by-step guidance facilitate use for everyone.
Who Should Use This Product?
- Investors: Evaluate GrafTech International Ltd.'s (EAF) market position before making investment decisions.
- CFOs and Financial Analysts: Enhance valuation methodologies and validate financial forecasts.
- Startup Founders: Understand the valuation strategies employed by established firms like GrafTech International Ltd. (EAF).
- Consultants: Provide comprehensive valuation assessments for your clients based on GrafTech International Ltd. (EAF).
- Students and Educators: Utilize current data to learn and teach valuation practices in real-world scenarios.
What the Template Contains
- Preloaded EAF Data: Historical and projected financial data, including revenue, EBIT, and capital expenditures.
- DCF and WACC Models: Professional-grade sheets for calculating intrinsic value and Weighted Average Cost of Capital.
- Editable Inputs: Yellow-highlighted cells for adjusting revenue growth, tax rates, and discount rates.
- Financial Statements: Comprehensive annual and quarterly financials for deeper analysis.
- Key Ratios: Profitability, leverage, and efficiency ratios to evaluate performance.
- Dashboard and Charts: Visual summaries of valuation outcomes and assumptions.
Disclaimer
All information, articles, and product details provided on this website are for general informational and educational purposes only. We do not claim any ownership over, nor do we intend to infringe upon, any trademarks, copyrights, logos, brand names, or other intellectual property mentioned or depicted on this site. Such intellectual property remains the property of its respective owners, and any references here are made solely for identification or informational purposes, without implying any affiliation, endorsement, or partnership.
We make no representations or warranties, express or implied, regarding the accuracy, completeness, or suitability of any content or products presented. Nothing on this website should be construed as legal, tax, investment, financial, medical, or other professional advice. In addition, no part of this site—including articles or product references—constitutes a solicitation, recommendation, endorsement, advertisement, or offer to buy or sell any securities, franchises, or other financial instruments, particularly in jurisdictions where such activity would be unlawful.
All content is of a general nature and may not address the specific circumstances of any individual or entity. It is not a substitute for professional advice or services. Any actions you take based on the information provided here are strictly at your own risk. You accept full responsibility for any decisions or outcomes arising from your use of this website and agree to release us from any liability in connection with your use of, or reliance upon, the content or products found herein.