
|
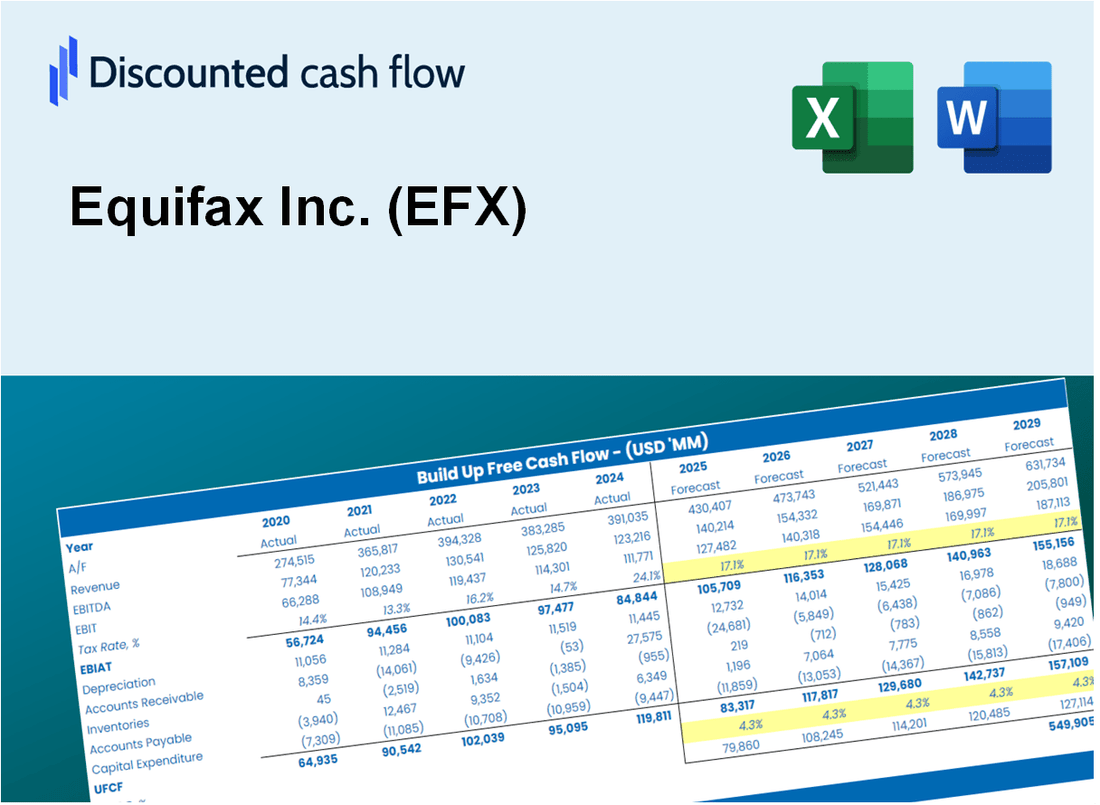
Equifax Inc. (EFX) DCF Valuation |
Fully Editable: Tailor To Your Needs In Excel Or Sheets
Professional Design: Trusted, Industry-Standard Templates
Investor-Approved Valuation Models
MAC/PC Compatible, Fully Unlocked
No Expertise Is Needed; Easy To Follow
Equifax Inc. (EFX) Bundle
Evaluate Equifax Inc.'s (EFX) financial prospects like an expert! This EFX DCF Calculator provides pre-filled financial data along with full flexibility to modify revenue growth, WACC, margins, and other essential assumptions to align with your predictions.
What You Will Get
- Real Equifax Data: Preloaded financials – encompassing revenue to EBIT – based on actual and projected figures.
- Full Customization: Modify all essential parameters (yellow cells) such as WACC, growth %, and tax rates.
- Instant Valuation Updates: Automatic recalculations to assess the impact of changes on Equifax’s fair value.
- Versatile Excel Template: Designed for quick edits, scenario testing, and comprehensive projections.
- Time-Saving and Accurate: Eliminate the need to build models from scratch while ensuring precision and flexibility.
Key Features
- Comprehensive Data: Equifax’s extensive historical financial statements and pre-filled forecasts.
- Customizable Inputs: Modify WACC, tax rates, revenue growth, and EBITDA margins as needed.
- Real-Time Insights: View Equifax’s intrinsic value recalibrate instantly.
- Intuitive Visualizations: Dashboard graphs showcase valuation results and essential metrics.
- Designed for Precision: A sophisticated tool tailored for analysts, investors, and finance professionals.
How It Works
- Download the Template: Gain immediate access to the Excel-based EFX DCF Calculator.
- Input Your Assumptions: Modify the yellow-highlighted cells for growth rates, WACC, margins, and other variables.
- Instant Calculations: The model automatically refreshes Equifax’s intrinsic value.
- Test Scenarios: Experiment with various assumptions to assess potential valuation shifts.
- Analyze and Decide: Utilize the outcomes to inform your investment or financial decisions.
Why Choose Equifax Inc. (EFX)?
- Save Time: Access comprehensive credit data instantly without extensive setup.
- Enhance Accuracy: Utilize reliable credit reports and analytics to minimize errors in decision-making.
- Fully Customizable: Adjust reports and insights to align with your specific business needs.
- User-Friendly Interface: Intuitive dashboards and visuals simplify data interpretation.
- Trusted by Professionals: Preferred by industry experts for its precision and effectiveness.
Who Should Use This Product?
- Investors: Evaluate Equifax’s valuation before making stock transactions.
- CFOs and Financial Analysts: Enhance valuation methodologies and validate forecasts.
- Startup Founders: Understand the valuation strategies of established companies like Equifax.
- Consultants: Provide comprehensive valuation assessments for clients.
- Students and Educators: Utilize current data to learn and teach valuation practices.
What the Template Contains
- Pre-Filled DCF Model: Equifax's (EFX) financial data preloaded for immediate use.
- WACC Calculator: Comprehensive calculations for Weighted Average Cost of Capital.
- Financial Ratios: Assess Equifax's profitability, leverage, and efficiency metrics.
- Editable Inputs: Modify assumptions such as growth rates, margins, and CAPEX to tailor your scenarios.
- Financial Statements: Access annual and quarterly reports for thorough analysis.
- Interactive Dashboard: Effortlessly visualize key valuation metrics and outcomes.
Disclaimer
All information, articles, and product details provided on this website are for general informational and educational purposes only. We do not claim any ownership over, nor do we intend to infringe upon, any trademarks, copyrights, logos, brand names, or other intellectual property mentioned or depicted on this site. Such intellectual property remains the property of its respective owners, and any references here are made solely for identification or informational purposes, without implying any affiliation, endorsement, or partnership.
We make no representations or warranties, express or implied, regarding the accuracy, completeness, or suitability of any content or products presented. Nothing on this website should be construed as legal, tax, investment, financial, medical, or other professional advice. In addition, no part of this site—including articles or product references—constitutes a solicitation, recommendation, endorsement, advertisement, or offer to buy or sell any securities, franchises, or other financial instruments, particularly in jurisdictions where such activity would be unlawful.
All content is of a general nature and may not address the specific circumstances of any individual or entity. It is not a substitute for professional advice or services. Any actions you take based on the information provided here are strictly at your own risk. You accept full responsibility for any decisions or outcomes arising from your use of this website and agree to release us from any liability in connection with your use of, or reliance upon, the content or products found herein.