
|
Enerflex Ltd. (EFXT) DCF Valuation |
Fully Editable: Tailor To Your Needs In Excel Or Sheets
Professional Design: Trusted, Industry-Standard Templates
Investor-Approved Valuation Models
MAC/PC Compatible, Fully Unlocked
No Expertise Is Needed; Easy To Follow
Enerflex Ltd. (EFXT) Bundle
Designed for accuracy, our (EFXT) DCF Calculator enables you to evaluate Enerflex Ltd. valuation using real-world financial data, providing full flexibility to modify all essential parameters for enhanced projections.
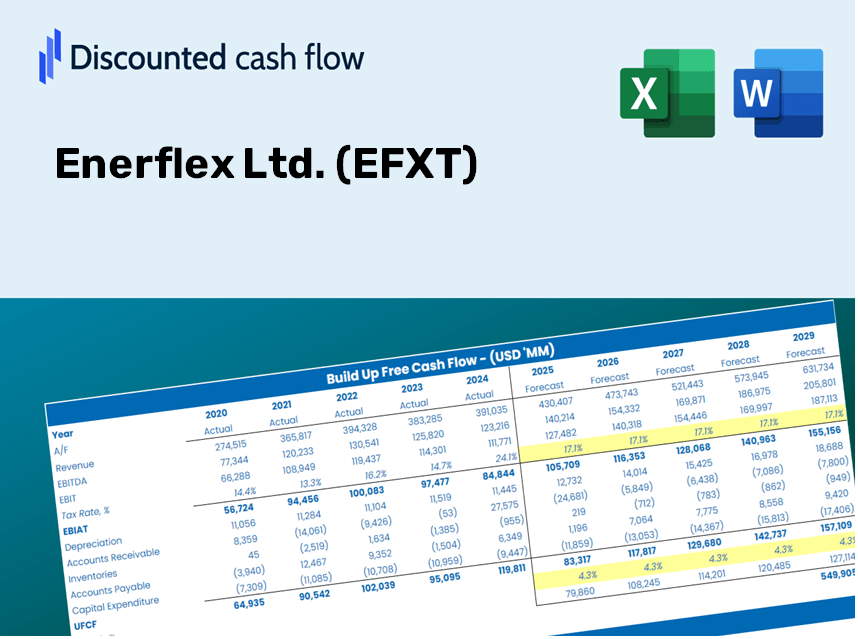
Discounted Cash Flow (DCF) - (USD MM)
| Year | AY1 2021 |
AY2 2022 |
AY3 2023 |
AY4 2024 |
AY5 2025 |
FY1 2026 |
FY2 2027 |
FY3 2028 |
FY4 2029 |
FY5 2030 |
|---|---|---|---|---|---|---|---|---|---|---|
| Revenue | 558.6 | 1,308.3 | 1,724.2 | 1,776.5 | 2,641.5 | 3,853.5 | 5,621.4 | 8,200.5 | 11,962.8 | 17,451.2 |
| Revenue Growth, % | 0 | 134.2 | 31.79 | 3.03 | 48.7 | 45.88 | 45.88 | 45.88 | 45.88 | 45.88 |
| EBITDA | 84.6 | 108.0 | 194.3 | 271.5 | 251.7 | 458.3 | 668.6 | 975.4 | 1,422.9 | 2,075.7 |
| EBITDA, % | 15.14 | 8.25 | 11.27 | 15.29 | 9.53 | 11.89 | 11.89 | 11.89 | 11.89 | 11.89 |
| Depreciation | 51.0 | 78.2 | 145.7 | 136.1 | .0 | 240.6 | 350.9 | 512.0 | 746.8 | 1,089.5 |
| Depreciation, % | 9.13 | 5.98 | 8.45 | 7.66 | 0 | 6.24 | 6.24 | 6.24 | 6.24 | 6.24 |
| EBIT | 33.6 | 29.8 | 48.6 | 135.4 | 251.7 | 217.8 | 317.7 | 463.4 | 676.0 | 986.2 |
| EBIT, % | 6.01 | 2.28 | 2.82 | 7.62 | 9.53 | 5.65 | 5.65 | 5.65 | 5.65 | 5.65 |
| Total Cash | 127.1 | 137.6 | 78.0 | 67.7 | 81.6 | 344.5 | 502.6 | 733.2 | 1,069.5 | 1,560.2 |
| Total Cash, percent | .0 | .0 | .0 | .0 | .0 | .0 | .0 | .0 | .0 | .0 |
| Account Receivables | 248.5 | 387.8 | 454.8 | 446.7 | 582.6 | 1,138.3 | 1,660.6 | 2,422.4 | 3,533.8 | 5,155.1 |
| Account Receivables, % | 44.48 | 29.64 | 26.38 | 25.14 | 22.05 | 29.54 | 29.54 | 29.54 | 29.54 | 29.54 |
| Inventories | 127.1 | 223.7 | 216.4 | 215.6 | 282.2 | 579.7 | 845.7 | 1,233.6 | 1,799.6 | 2,625.3 |
| Inventories, % | 22.75 | 17.1 | 12.55 | 12.14 | 10.68 | 15.04 | 15.04 | 15.04 | 15.04 | 15.04 |
| Accounts Payable | 172.4 | 332.6 | 306.1 | 290.7 | 387.0 | 809.6 | 1,181.0 | 1,722.9 | 2,513.4 | 3,666.5 |
| Accounts Payable, % | 30.85 | 25.42 | 17.76 | 16.36 | 14.65 | 21.01 | 21.01 | 21.01 | 21.01 | 21.01 |
| Capital Expenditure | -33.1 | -62.9 | -81.7 | -13.2 | -118.2 | -159.4 | -232.6 | -339.3 | -495.0 | -722.0 |
| Capital Expenditure, % | -5.92 | -4.81 | -4.74 | -0.74565 | -4.47 | -4.14 | -4.14 | -4.14 | -4.14 | -4.14 |
| Tax Rate, % | 60.74 | 60.74 | 60.74 | 60.74 | 60.74 | 60.74 | 60.74 | 60.74 | 60.74 | 60.74 |
| EBITAT | -16.3 | 37.7 | 77.5 | 53.5 | 98.8 | 121.4 | 177.1 | 258.4 | 376.9 | 549.8 |
| Depreciation | ||||||||||
| Changes in Account Receivables | ||||||||||
| Changes in Inventories | ||||||||||
| Changes in Accounts Payable | ||||||||||
| Capital Expenditure | ||||||||||
| UFCF | -201.6 | -22.7 | 55.4 | 169.8 | -125.4 | -228.1 | -121.3 | -176.9 | -258.1 | -376.6 |
| WACC, % | 10.58 | 13.02 | 13.02 | 11.54 | 11.54 | 11.94 | 11.94 | 11.94 | 11.94 | 11.94 |
| PV UFCF | ||||||||||
| SUM PV UFCF | -805.4 | |||||||||
| Long Term Growth Rate, % | 2.00 | |||||||||
| Free cash flow (T + 1) | -384 | |||||||||
| Terminal Value | -3,864 | |||||||||
| Present Terminal Value | -2,199 | |||||||||
| Enterprise Value | -3,004 | |||||||||
| Net Debt | 628 | |||||||||
| Equity Value | -3,632 | |||||||||
| Diluted Shares Outstanding, MM | 123 | |||||||||
| Equity Value Per Share | -29.51 |
What You Will Receive
- Genuine Enerflex Data: Comprehensive financial information – from revenue to EBIT – based on both actual and forecasted figures.
- Complete Customization: Modify all essential parameters (yellow cells) such as WACC, growth %, and tax rates.
- Real-Time Valuation Adjustments: Automatic updates to evaluate the effects of any changes on Enerflex’s fair value.
- Flexible Excel Template: Designed for quick modifications, scenario analysis, and in-depth projections.
- Efficient and Precise: Eliminate the need to construct models from the ground up while preserving accuracy and adaptability.
Key Features
- Comprehensive DCF Calculator: Features detailed unlevered and levered DCF valuation models tailored for Enerflex Ltd. (EFXT).
- WACC Calculator: Pre-configured Weighted Average Cost of Capital sheet with adjustable inputs for accurate assessments.
- Customizable Forecast Assumptions: Adjust growth rates, capital expenditures, and discount rates to fit Enerflex Ltd. (EFXT).
- Integrated Financial Ratios: Evaluate profitability, leverage, and efficiency ratios specifically for Enerflex Ltd. (EFXT).
- Interactive Dashboard and Charts: Visual representations provide a clear overview of key valuation metrics for streamlined analysis.
How It Operates
- Download the Template: Gain immediate access to the Excel-based EFXT DCF Calculator.
- Input Your Assumptions: Modify the yellow-highlighted cells for growth rates, WACC, margins, and other variables.
- Instant Calculations: The model will automatically refresh to show Enerflex Ltd.'s intrinsic value.
- Test Scenarios: Experiment with different assumptions to assess potential changes in valuation.
- Analyze and Decide: Utilize the findings to inform your investment strategy or financial assessments.
Why Choose This Calculator for Enerflex Ltd. (EFXT)?
- Reliable Data: Access accurate financial information for Enerflex Ltd. to ensure trustworthy valuation outcomes.
- Flexible Options: Tailor essential inputs such as growth rates, WACC, and tax rates to align with your forecasts.
- Efficient: Built-in calculations save you time and eliminate the hassle of starting from scratch.
- Professional-Quality Tool: Specifically crafted for investors, analysts, and consultants in the energy sector.
- Easy to Use: User-friendly design and clear step-by-step guidance make it accessible for everyone.
Who Can Benefit from Enerflex Ltd. (EFXT)?
- Institutional Investors: Develop comprehensive and trustworthy valuation models for assessing portfolios.
- Corporate Finance Departments: Examine valuation scenarios to inform strategic decision-making.
- Financial Consultants and Advisors: Deliver precise valuation insights for Enerflex Ltd. (EFXT) to clients.
- Students and Instructors: Utilize real-world data to enhance financial modeling skills and education.
- Energy Sector Enthusiasts: Gain insights into the valuation processes of companies like Enerflex Ltd. (EFXT) in the market.
What the Template Includes
- Pre-Filled Data: Contains Enerflex Ltd.'s (EFXT) historical financial data and projections.
- Discounted Cash Flow Model: An editable DCF valuation model with automatic computation functionalities.
- Weighted Average Cost of Capital (WACC): A dedicated sheet for WACC calculations based on user-defined inputs.
- Key Financial Ratios: Evaluate Enerflex Ltd.'s (EFXT) profitability, efficiency, and financial leverage.
- Customizable Inputs: Easily adjust parameters such as revenue growth, profit margins, and tax rates.
- Intuitive Dashboard: Visuals and tables summarizing essential valuation outcomes.
Disclaimer
All information, articles, and product details provided on this website are for general informational and educational purposes only. We do not claim any ownership over, nor do we intend to infringe upon, any trademarks, copyrights, logos, brand names, or other intellectual property mentioned or depicted on this site. Such intellectual property remains the property of its respective owners, and any references here are made solely for identification or informational purposes, without implying any affiliation, endorsement, or partnership.
We make no representations or warranties, express or implied, regarding the accuracy, completeness, or suitability of any content or products presented. Nothing on this website should be construed as legal, tax, investment, financial, medical, or other professional advice. In addition, no part of this site—including articles or product references—constitutes a solicitation, recommendation, endorsement, advertisement, or offer to buy or sell any securities, franchises, or other financial instruments, particularly in jurisdictions where such activity would be unlawful.
All content is of a general nature and may not address the specific circumstances of any individual or entity. It is not a substitute for professional advice or services. Any actions you take based on the information provided here are strictly at your own risk. You accept full responsibility for any decisions or outcomes arising from your use of this website and agree to release us from any liability in connection with your use of, or reliance upon, the content or products found herein.