
|
Eledon Pharmaceuticals, Inc. (ELDN) DCF Valuation |
Fully Editable: Tailor To Your Needs In Excel Or Sheets
Professional Design: Trusted, Industry-Standard Templates
Investor-Approved Valuation Models
MAC/PC Compatible, Fully Unlocked
No Expertise Is Needed; Easy To Follow
Eledon Pharmaceuticals, Inc. (ELDN) Bundle
Enhance your investment strategies with the Eledon Pharmaceuticals, Inc. (ELDN) DCF Calculator! Explore authentic financial data, adjust growth projections and expenses, and instantly visualize how these changes affect the intrinsic value of Eledon Pharmaceuticals, Inc. (ELDN).
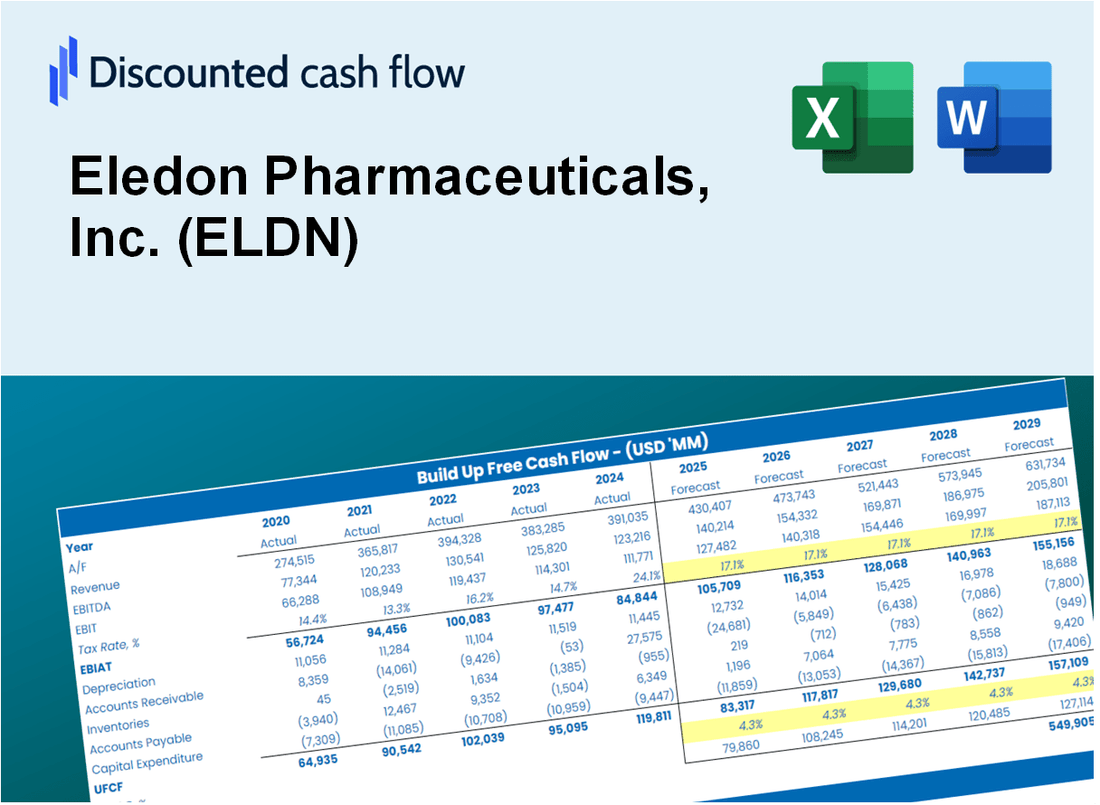
Discounted Cash Flow (DCF) - (USD MM)
| Year | AY1 2020 |
AY2 2021 |
AY3 2022 |
AY4 2023 |
AY5 2024 |
FY1 2025 |
FY2 2026 |
FY3 2027 |
FY4 2028 |
FY5 2029 |
|---|---|---|---|---|---|---|---|---|---|---|
| Revenue | .1 | .0 | .0 | .0 | .0 | .0 | .0 | .0 | .0 | .0 |
| Revenue Growth, % | 0 | -100 | 0 | 0 | 0 | -25 | -25 | -25 | -25 | -25 |
| EBITDA | -23.0 | -36.7 | -87.6 | -116.2 | -35.4 | .0 | .0 | .0 | .0 | .0 |
| EBITDA, % | -19193.33 | 100 | 100 | 100 | 100 | 60 | 60 | 60 | 60 | 60 |
| Depreciation | .2 | .2 | .4 | .4 | .4 | .0 | .0 | .0 | .0 | .0 |
| Depreciation, % | 152.5 | 100 | 100 | 100 | 100 | 100 | 100 | 100 | 100 | 100 |
| EBIT | -23.2 | -36.9 | -88.0 | -116.5 | -35.8 | .0 | .0 | .0 | .0 | .0 |
| EBIT, % | -19345.83 | 100 | 100 | 100 | 100 | 60 | 60 | 60 | 60 | 60 |
| Total Cash | 114.2 | 84.8 | 56.4 | 51.1 | 140.2 | .0 | .0 | .0 | .0 | .0 |
| Total Cash, percent | .1 | .0 | .0 | .0 | .0 | .0 | .0 | .0 | .0 | .0 |
| Account Receivables | .1 | .0 | .0 | .0 | .0 | .0 | .0 | .0 | .0 | .0 |
| Account Receivables, % | 91.67 | 100 | 100 | 100 | 100 | 98.33 | 98.33 | 98.33 | 98.33 | 98.33 |
| Inventories | 1.3 | .0 | .0 | .0 | .0 | .0 | .0 | .0 | .0 | .0 |
| Inventories, % | 1072.5 | 100 | 100 | 100 | 100 | 100 | 100 | 100 | 100 | 100 |
| Accounts Payable | 1.4 | 1.8 | 2.2 | 1.0 | 5.8 | .0 | .0 | .0 | .0 | .0 |
| Accounts Payable, % | 1138.33 | 100 | 100 | 100 | 100 | 100 | 100 | 100 | 100 | 100 |
| Capital Expenditure | .0 | .0 | .0 | .0 | .0 | .0 | .0 | .0 | .0 | .0 |
| Capital Expenditure, % | 0 | 100 | 100 | 100 | 100 | 0 | 0 | 0 | 0 | 0 |
| Tax Rate, % | 1.21 | 1.21 | 1.21 | 1.21 | 1.21 | 1.21 | 1.21 | 1.21 | 1.21 | 1.21 |
| EBITAT | -22.8 | -34.5 | -87.5 | -116.5 | -35.3 | .0 | .0 | .0 | .0 | .0 |
| Depreciation | ||||||||||
| Changes in Account Receivables | ||||||||||
| Changes in Inventories | ||||||||||
| Changes in Accounts Payable | ||||||||||
| Capital Expenditure | ||||||||||
| UFCF | -22.7 | -32.5 | -86.7 | -117.4 | -30.1 | -5.8 | .0 | .0 | .0 | .0 |
| WACC, % | 5.61 | 5.61 | 5.61 | 5.61 | 5.61 | 5.61 | 5.61 | 5.61 | 5.61 | 5.61 |
| PV UFCF | ||||||||||
| SUM PV UFCF | -5.5 | |||||||||
| Long Term Growth Rate, % | 2.00 | |||||||||
| Free cash flow (T + 1) | 0 | |||||||||
| Terminal Value | 0 | |||||||||
| Present Terminal Value | 0 | |||||||||
| Enterprise Value | -6 | |||||||||
| Net Debt | -20 | |||||||||
| Equity Value | 14 | |||||||||
| Diluted Shares Outstanding, MM | 49 | |||||||||
| Equity Value Per Share | 0.29 |
What You Will Get
- Comprehensive ELDN Financials: Access to historical and projected data for precise valuation.
- Customizable Inputs: Adjust WACC, tax rates, revenue growth, and capital expenditures as needed.
- Dynamic Calculations: Intrinsic value and NPV are automatically computed in real-time.
- Scenario Analysis: Evaluate various scenarios to assess Eledon Pharmaceuticals' future performance.
- User-Friendly Design: Created for industry professionals while remaining accessible to newcomers.
Key Features
- Comprehensive DCF Model: Features detailed unlevered and levered DCF valuation frameworks tailored for Eledon Pharmaceuticals, Inc. (ELDN).
- WACC Analysis Tool: Pre-configured Weighted Average Cost of Capital sheet with adjustable parameters specific to ELDN.
- Customizable Forecast Inputs: Easily adjust growth projections, capital expenditures, and discount rates to fit Eledon’s business model.
- Integrated Financial Ratios: Evaluate profitability, leverage, and efficiency ratios relevant to Eledon Pharmaceuticals, Inc. (ELDN).
- Interactive Dashboard and Visualizations: Graphical representations highlight essential valuation metrics for streamlined analysis.
How It Works
- Step 1: Download the prebuilt Excel template featuring Eledon Pharmaceuticals, Inc. (ELDN) data.
- Step 2: Navigate through the pre-filled sheets to familiarize yourself with the essential metrics.
- Step 3: Modify forecasts and assumptions in the editable yellow cells (WACC, growth, margins).
- Step 4: Instantly see the recalculated results, including the intrinsic value of Eledon Pharmaceuticals, Inc. (ELDN).
- Step 5: Utilize the outputs to make informed investment decisions or create detailed reports.
Why Choose This Calculator?
- Designed for Experts: A sophisticated tool utilized by researchers, financial analysts, and industry leaders.
- Comprehensive Data: Eledon's historical and projected financials preloaded for enhanced precision.
- Flexible Scenario Analysis: Effortlessly simulate various forecasts and assumptions.
- Insightful Outputs: Automatically computes intrinsic value, NPV, and essential metrics.
- User-Friendly: Step-by-step guidance ensures a smooth user experience.
Who Should Use This Product?
- Investors: Accurately estimate Eledon's fair value before making investment decisions.
- CFOs: Utilize a professional-grade DCF model for financial reporting and analysis related to Eledon Pharmaceuticals.
- Consultants: Quickly customize the template for valuation reports tailored to Eledon Pharmaceuticals' clients.
- Entrepreneurs: Gain insights into financial modeling techniques employed by leading pharmaceutical companies.
- Educators: Use it as a teaching resource to illustrate valuation methodologies in the biotech sector.
What the Template Contains
- Pre-Filled DCF Model: Eledon Pharmaceuticals’ financial data preloaded for immediate use.
- WACC Calculator: Detailed calculations for Weighted Average Cost of Capital.
- Financial Ratios: Evaluate Eledon Pharmaceuticals’ profitability, leverage, and efficiency.
- Editable Inputs: Change assumptions such as growth, margins, and CAPEX to fit your scenarios.
- Financial Statements: Annual and quarterly reports to support detailed analysis.
- Interactive Dashboard: Easily visualize key valuation metrics and results.
Disclaimer
All information, articles, and product details provided on this website are for general informational and educational purposes only. We do not claim any ownership over, nor do we intend to infringe upon, any trademarks, copyrights, logos, brand names, or other intellectual property mentioned or depicted on this site. Such intellectual property remains the property of its respective owners, and any references here are made solely for identification or informational purposes, without implying any affiliation, endorsement, or partnership.
We make no representations or warranties, express or implied, regarding the accuracy, completeness, or suitability of any content or products presented. Nothing on this website should be construed as legal, tax, investment, financial, medical, or other professional advice. In addition, no part of this site—including articles or product references—constitutes a solicitation, recommendation, endorsement, advertisement, or offer to buy or sell any securities, franchises, or other financial instruments, particularly in jurisdictions where such activity would be unlawful.
All content is of a general nature and may not address the specific circumstances of any individual or entity. It is not a substitute for professional advice or services. Any actions you take based on the information provided here are strictly at your own risk. You accept full responsibility for any decisions or outcomes arising from your use of this website and agree to release us from any liability in connection with your use of, or reliance upon, the content or products found herein.