
|
EMX Royalty Corporation (EMX) DCF Valuation |
Fully Editable: Tailor To Your Needs In Excel Or Sheets
Professional Design: Trusted, Industry-Standard Templates
Investor-Approved Valuation Models
MAC/PC Compatible, Fully Unlocked
No Expertise Is Needed; Easy To Follow
EMX Royalty Corporation (EMX) Bundle
Explore the financial prospects of EMX Royalty Corporation (EMX) with our user-friendly DCF Calculator! Enter your assumptions regarding growth, margins, and expenses to calculate the intrinsic value of EMX and enhance your investment strategy.
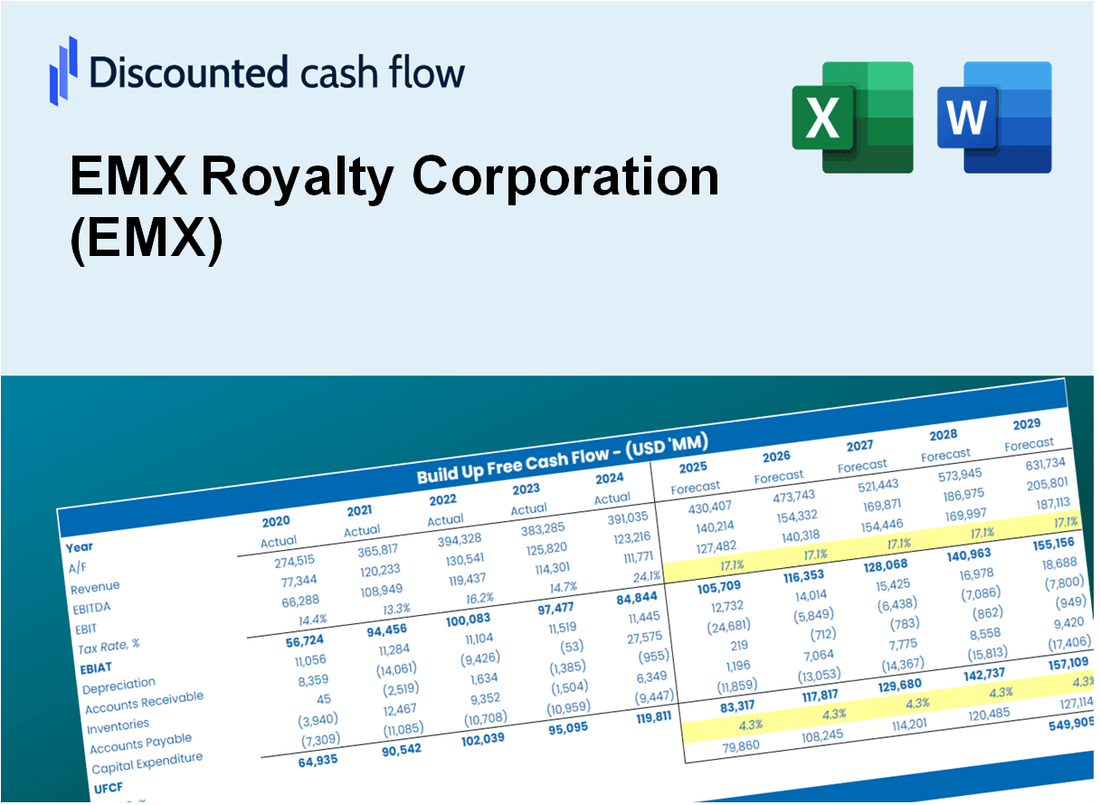
Discounted Cash Flow (DCF) - (USD MM)
| Year | AY1 2020 |
AY2 2021 |
AY3 2022 |
AY4 2023 |
AY5 2024 |
FY1 2025 |
FY2 2026 |
FY3 2027 |
FY4 2028 |
FY5 2029 |
|---|---|---|---|---|---|---|---|---|---|---|
| Revenue | .8 | 4.6 | 4.9 | 14.5 | 17.0 | 26.5 | 41.3 | 64.5 | 100.7 | 157.1 |
| Revenue Growth, % | 0 | 457.46 | 7 | 193.46 | 17.34 | 56.08 | 56.08 | 56.08 | 56.08 | 56.08 |
| EBITDA | -6.0 | -15.5 | 13.8 | 4.9 | 7.7 | -1.1 | -1.7 | -2.7 | -4.1 | -6.5 |
| EBITDA, % | -727.96 | -336.43 | 279.56 | 34.1 | 45.3 | -4.12 | -4.12 | -4.12 | -4.12 | -4.12 |
| Depreciation | .7 | 2.2 | 4.1 | 3.7 | 4.7 | 14.1 | 21.9 | 34.3 | 53.5 | 83.4 |
| Depreciation, % | 80.25 | 48.46 | 83.67 | 25.73 | 27.42 | 53.11 | 53.11 | 53.11 | 53.11 | 53.11 |
| EBIT | -6.7 | -17.7 | 9.7 | 1.2 | 3.0 | -3.9 | -6.1 | -9.5 | -14.8 | -23.2 |
| EBIT, % | -808.2 | -384.89 | 195.89 | 8.37 | 17.88 | -14.75 | -14.75 | -14.75 | -14.75 | -14.75 |
| Total Cash | 38.7 | 22.7 | 18.5 | 19.0 | 22.9 | 26.5 | 41.3 | 64.5 | 100.7 | 157.1 |
| Total Cash, percent | .0 | .0 | .0 | .0 | .0 | .0 | .0 | .0 | .0 | .0 |
| Account Receivables | 2.1 | 6.7 | 8.2 | 5.5 | 10.0 | 21.0 | 32.8 | 51.2 | 79.9 | 124.7 |
| Account Receivables, % | 256.08 | 146.11 | 167.42 | 38.17 | 58.74 | 79.38 | 79.38 | 79.38 | 79.38 | 79.38 |
| Inventories | .6 | .0 | .0 | .0 | .0 | 4.0 | 6.2 | 9.7 | 15.1 | 23.6 |
| Inventories, % | 75.11 | 0 | 0 | 0 | 0 | 15.02 | 15.02 | 15.02 | 15.02 | 15.02 |
| Accounts Payable | 2.6 | 2.1 | 1.7 | 2.0 | 3.2 | 11.2 | 17.5 | 27.4 | 42.7 | 66.7 |
| Accounts Payable, % | 309.75 | 45.92 | 33.83 | 13.82 | 18.68 | 42.45 | 42.45 | 42.45 | 42.45 | 42.45 |
| Capital Expenditure | -3.0 | -24.2 | -.8 | -.1 | -2.5 | -12.3 | -19.2 | -29.9 | -46.7 | -72.9 |
| Capital Expenditure, % | -357.93 | -526.13 | -16.43 | -0.84832 | -14.7 | -46.4 | -46.4 | -46.4 | -46.4 | -46.4 |
| Tax Rate, % | 843.89 | 843.89 | 843.89 | 843.89 | 843.89 | 843.89 | 843.89 | 843.89 | 843.89 | 843.89 |
| EBITAT | -11.8 | -20.0 | 3.9 | 2.2 | -22.6 | -2.7 | -4.1 | -6.5 | -10.1 | -15.8 |
| Depreciation | ||||||||||
| Changes in Account Receivables | ||||||||||
| Changes in Inventories | ||||||||||
| Changes in Accounts Payable | ||||||||||
| Capital Expenditure | ||||||||||
| UFCF | -14.3 | -46.4 | 5.2 | 8.8 | -23.7 | -7.8 | -9.1 | -14.2 | -22.1 | -34.6 |
| WACC, % | 5.76 | 5.76 | 5.43 | 5.76 | 5.21 | 5.58 | 5.58 | 5.58 | 5.58 | 5.58 |
| PV UFCF | ||||||||||
| SUM PV UFCF | -71.8 | |||||||||
| Long Term Growth Rate, % | 2.00 | |||||||||
| Free cash flow (T + 1) | -35 | |||||||||
| Terminal Value | -984 | |||||||||
| Present Terminal Value | -750 | |||||||||
| Enterprise Value | -822 | |||||||||
| Net Debt | 6 | |||||||||
| Equity Value | -828 | |||||||||
| Diluted Shares Outstanding, MM | 113 | |||||||||
| Equity Value Per Share | -7.35 |
What You Will Receive
- Adjustable Forecast Parameters: Modify key inputs (growth %, margins, WACC) effortlessly to explore various scenarios.
- Comprehensive Market Data: EMX Royalty Corporation’s financial information pre-loaded to facilitate your analysis.
- Instant DCF Outputs: The model computes Net Present Value (NPV) and intrinsic value automatically.
- Tailored and Professional: A refined Excel model designed to meet your valuation requirements.
- Designed for Analysts and Investors: Perfect for assessing projections, confirming strategies, and optimizing efficiency.
Key Features
- Comprehensive Data Access: EMX Royalty Corporation’s (EMX) historical financial data and projected forecasts.
- Customizable Parameters: Modify WACC, tax rates, revenue growth, and EBITDA margins to suit your analysis.
- Real-Time Insights: Observe the intrinsic value of EMX recalibrating instantly.
- Intuitive Visualizations: Dashboard graphs illustrate valuation outcomes and essential metrics.
- Designed for Precision: A robust tool tailored for analysts, investors, and finance professionals.
How It Works
- Step 1: Download the prebuilt Excel template featuring EMX Royalty Corporation’s (EMX) data.
- Step 2: Navigate through the pre-filled sheets to familiarize yourself with the essential metrics.
- Step 3: Adjust forecasts and assumptions in the editable yellow cells (WACC, growth, margins).
- Step 4: Instantly view recalibrated results, including EMX Royalty Corporation’s (EMX) intrinsic value.
- Step 5: Make well-informed investment decisions or create reports based on the outputs.
Why Choose EMX Royalty Corporation (EMX)?
- Comprehensive Resource: Offers a wide range of royalty and streaming solutions tailored for the mining sector.
- Flexible Investment Options: Customize your investment strategy with various royalty and streaming agreements.
- In-Depth Analysis: Provides detailed insights into the performance and potential of mining projects.
- Extensive Data: Access to historical and projected mining data for informed decision-making.
- Industry Expertise: Trusted by investors and industry professionals for strategic mining investments.
Who Should Use EMX Royalty Corporation (EMX)?
- Mining Students: Understand royalty agreements and their impact on project financing.
- Researchers: Utilize EMX's data for studies on resource development and market trends.
- Investors: Evaluate investment opportunities and assess the value of royalty portfolios with EMX.
- Analysts: Enhance your analysis with detailed reports and insights on EMX's operations.
- Entrepreneurs: Learn how royalty companies like EMX operate within the mining sector.
What the Template Contains
- Historical Data: Includes EMX Royalty Corporation's (EMX) past financials and baseline forecasts.
- DCF and Levered DCF Models: Detailed templates to calculate EMX's intrinsic value.
- WACC Sheet: Pre-built calculations for Weighted Average Cost of Capital.
- Editable Inputs: Modify key drivers like growth rates, EBITDA %, and CAPEX assumptions.
- Quarterly and Annual Statements: A complete breakdown of EMX's financials.
- Interactive Dashboard: Visualize valuation results and projections dynamically.
Disclaimer
All information, articles, and product details provided on this website are for general informational and educational purposes only. We do not claim any ownership over, nor do we intend to infringe upon, any trademarks, copyrights, logos, brand names, or other intellectual property mentioned or depicted on this site. Such intellectual property remains the property of its respective owners, and any references here are made solely for identification or informational purposes, without implying any affiliation, endorsement, or partnership.
We make no representations or warranties, express or implied, regarding the accuracy, completeness, or suitability of any content or products presented. Nothing on this website should be construed as legal, tax, investment, financial, medical, or other professional advice. In addition, no part of this site—including articles or product references—constitutes a solicitation, recommendation, endorsement, advertisement, or offer to buy or sell any securities, franchises, or other financial instruments, particularly in jurisdictions where such activity would be unlawful.
All content is of a general nature and may not address the specific circumstances of any individual or entity. It is not a substitute for professional advice or services. Any actions you take based on the information provided here are strictly at your own risk. You accept full responsibility for any decisions or outcomes arising from your use of this website and agree to release us from any liability in connection with your use of, or reliance upon, the content or products found herein.