
|
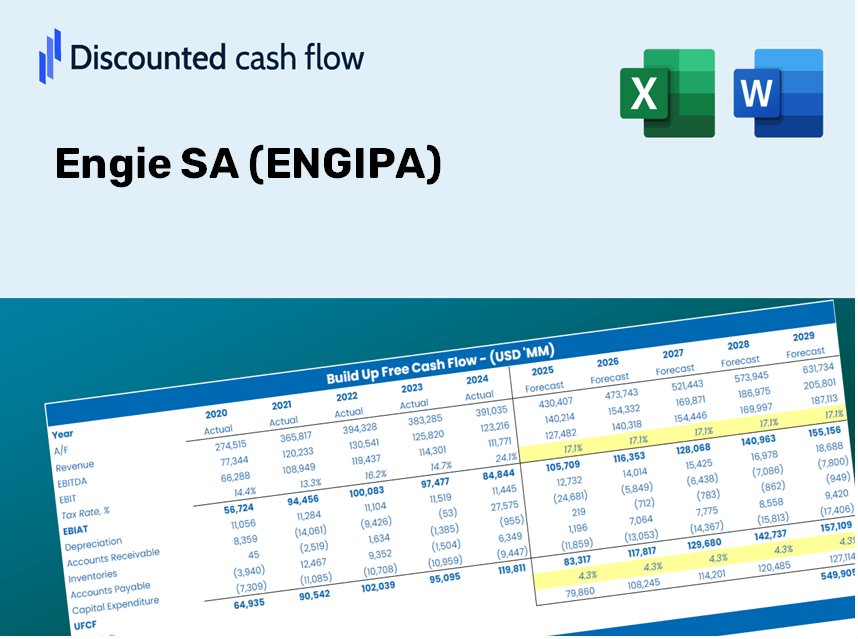
Engie SA (ENGI.PA) DCF Valuation |
Fully Editable: Tailor To Your Needs In Excel Or Sheets
Professional Design: Trusted, Industry-Standard Templates
Investor-Approved Valuation Models
MAC/PC Compatible, Fully Unlocked
No Expertise Is Needed; Easy To Follow
Engie SA (ENGI.PA) Bundle
As an investor or analyst, the Engie SA (ENGIPA) DCF Calculator serves as your go-to resource for accurate valuation. Equipped with real data from Engie SA, you can adjust forecasts and observe the effects in real-time.
What You Will Receive
- Authentic ENGIPA Financials: Access to both historical and projected data for precise valuation.
- Customizable Inputs: Adjust WACC, tax rates, revenue growth, and capital expenditures as needed.
- Dynamic Calculations: Intrinsic value and NPV are computed automatically.
- Scenario Evaluation: Analyze various scenarios to assess Engie SA's future performance.
- User-Friendly Design: Crafted for professionals while remaining approachable for newcomers.
Core Advantages
- Customizable Financial Inputs: Adjust essential parameters such as revenue growth, EBITDA %, and capital expenditures.
- Instant DCF Valuation: Quickly computes intrinsic value, NPV, and additional metrics.
- High Precision Results: Leverages real-world financial data from Engie SA (ENGIPA) for authentic valuation outcomes.
- Simplified Scenario Testing: Effortlessly evaluate different assumptions and analyze potential results.
- Efficiency Booster: Remove the need for creating intricate valuation models from the ground up.
How It Works
- Step 1: Download the Excel file.
- Step 2: Review Engie SA’s pre-filled financial data and forecasts.
- Step 3: Adjust key inputs such as revenue growth, WACC, and tax rates (highlighted cells).
- Step 4: Observe the DCF model update in real-time as you change assumptions.
- Step 5: Evaluate the outputs and leverage the results for your investment decisions.
Why Opt for This Calculator for Engie SA (ENGIPA)?
- Precision: Utilizes actual Engie SA financial data for reliable outcomes.
- Adaptability: Built to allow users to easily test and adjust inputs as needed.
- Efficiency: Eliminate the complexities of creating a DCF model from the ground up.
- Executive Quality: Crafted with a focus on accuracy and usability suitable for CFOs.
- Intuitive: Designed for ease of use, making it accessible to those without extensive financial modeling skills.
Who Can Benefit from This Product?
- Investors: Evaluate Engie SA’s (ENGIPA) valuation prior to making stock trades.
- CFOs and Financial Analysts: Enhance valuation workflows and assess financial forecasts.
- Startup Founders: Discover how leading public companies like Engie SA are appraised.
- Consultants: Provide clients with comprehensive and professional valuation reports.
- Students and Educators: Utilize real data to learn and teach effective valuation methods.
Contents of the Template
- Pre-Filled Data: Contains Engie SA's historical financial information and projections.
- Discounted Cash Flow Model: An editable DCF valuation model with automated calculations.
- Weighted Average Cost of Capital (WACC): A dedicated worksheet for computing WACC using customizable inputs.
- Key Financial Ratios: Evaluate Engie SA's profitability, operational efficiency, and financial leverage.
- Customizable Inputs: Easily modify revenue growth rates, margins, and tax rates.
- Clear Dashboard: Visual representations and tables highlighting key valuation outcomes.
Disclaimer
All information, articles, and product details provided on this website are for general informational and educational purposes only. We do not claim any ownership over, nor do we intend to infringe upon, any trademarks, copyrights, logos, brand names, or other intellectual property mentioned or depicted on this site. Such intellectual property remains the property of its respective owners, and any references here are made solely for identification or informational purposes, without implying any affiliation, endorsement, or partnership.
We make no representations or warranties, express or implied, regarding the accuracy, completeness, or suitability of any content or products presented. Nothing on this website should be construed as legal, tax, investment, financial, medical, or other professional advice. In addition, no part of this site—including articles or product references—constitutes a solicitation, recommendation, endorsement, advertisement, or offer to buy or sell any securities, franchises, or other financial instruments, particularly in jurisdictions where such activity would be unlawful.
All content is of a general nature and may not address the specific circumstances of any individual or entity. It is not a substitute for professional advice or services. Any actions you take based on the information provided here are strictly at your own risk. You accept full responsibility for any decisions or outcomes arising from your use of this website and agree to release us from any liability in connection with your use of, or reliance upon, the content or products found herein.