
|
EPAM Systems, Inc. (EPAM): BCG Matrix [Dec-2025 Updated] |
Fully Editable: Tailor To Your Needs In Excel Or Sheets
Professional Design: Trusted, Industry-Standard Templates
Investor-Approved Valuation Models
MAC/PC Compatible, Fully Unlocked
No Expertise Is Needed; Easy To Follow
EPAM Systems, Inc. (EPAM) Bundle
You're trying to get a clear picture of EPAM Systems, Inc.'s business health heading into the end of 2025, so let's map its portfolio using the BCG Matrix. Right now, the Stars are blazing, driven by AI/GenAI-Native Services and a Financial Services vertical up 29.3% in Q1, while the Cash Cows-like the North American Operations providing 58% of Q3 revenue-are funding the fight. Definitly, we also see Dogs like Legacy Manual Testing Services that need phasing out, and big Question Marks such as the massive India expansion that demand heavy capital before their payoff is certain. This matrix cuts straight to where EPAM Systems, Inc. is making its money and where it's placing its riskiest, highest-potential bets.
Background of EPAM Systems, Inc. (EPAM)
You're looking at EPAM Systems, Inc. (EPAM), a global leader in digital transformation services and product engineering, and honestly, the numbers coming out of late 2025 show some real momentum. This company specializes in deep engineering, cloud services, and increasingly, building out what they call the AI foundation for enterprises worldwide. They've successfully navigated the industry slowdown we saw earlier, and now their focus on AI-Native organizations is really paying off.
Let's look at the top line. For the third quarter ending September 30, 2025, EPAM Systems reported revenues hitting $1.394 billion, which was a solid 19.4% increase year-over-year. That's defintely a strong signal of reacceleration. They've even raised their full-year 2025 revenue guidance twice now, projecting total revenue between $5.430 billion and $5.445 billion at the midpoint, suggesting about 15.0% growth for the full year.
Operationally, the profitability picture is interesting. For Q3 2025, their non-GAAP income from operations landed at 16.0% of revenues. For the full year 2025, they are guiding that non-GAAP operating margin to settle in the 15.0% to 15.3% range. You should also note that North America remains their core market, driving roughly 60% of the total revenue base.
To be fair, while revenue growth is strong, some profitability metrics like GAAP diluted EPS saw a year-over-year decline in Q3, though non-GAAP EPS was up slightly. Still, EPAM Systems is signaling confidence by continuing to return capital; they announced a new share repurchase plan for up to $1 billion in additional buybacks. As of September 30, 2025, their liquidity position looks robust, with cash, cash equivalents, and restricted cash totaling $1.244 billion.
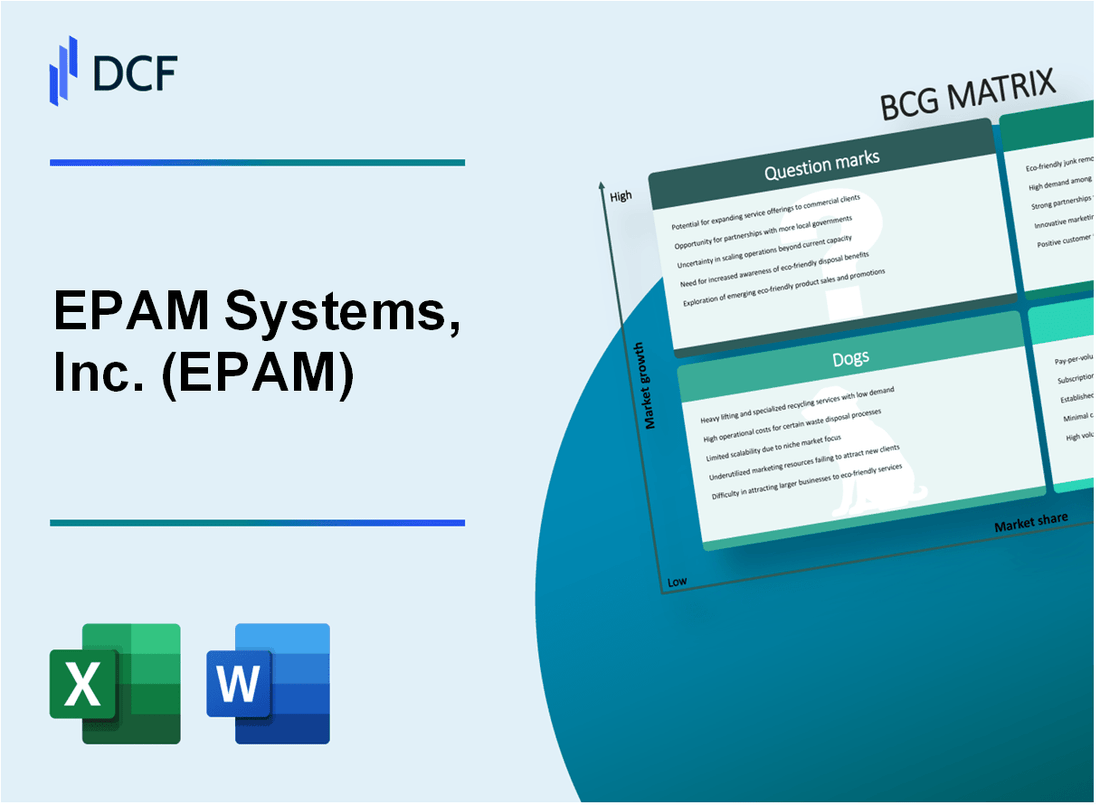
EPAM Systems, Inc. (EPAM) - BCG Matrix: Stars
The Star quadrant for EPAM Systems, Inc. (EPAM) is characterized by services operating in high-growth markets where the company maintains a strong market share, demanding significant investment to sustain leadership.
AI/GenAI-Native Services
This segment is the primary high-growth engine, directly contributing to the raised 2025 revenue outlook for EPAM Systems, Inc. The full-year 2025 expected revenue range is now between $5.430 billion and $5.445 billion. This updated projection reflects a year-over-year growth rate of 15.0% at the midpoint. The company has explicitly shifted its strategic focus further toward these AI-native services.
Financial Services Vertical
The Financial Services vertical demonstrated exceptional momentum in the first quarter of 2025. Revenue for this vertical reached $314 million, marking a growth of 29.3% year-over-year. This performance signifies strong market share gains in a critical sector for EPAM Systems, Inc. Furthermore, in the third quarter of 2025, this vertical grew 32.7% on a reported basis.
Emerging Verticals
Emerging Verticals showed a significant surge in Q1 2025, with revenue increasing to $221 million, representing a growth of 22.8%. This growth rate outpaced the company's overall organic growth rate for the period, indicating high-velocity market penetration. The momentum continued into Q3 2025, with reported growth of 38.9%.
Cloud and Data Foundation Engineering
Services related to Cloud and Data Foundation Engineering are high-demand offerings, considered essential for clients to achieve AI-readiness. The success in these areas contributed to the overall upward revision of the full-year organic constant currency revenue growth outlook to a 4.6% midpoint for 2025. Clients are engaging EPAM Systems, Inc. to build out their data platforms and modernize their cloud environments.
The following table summarizes key financial metrics related to the growth drivers identified as Stars:
| Metric | Value | Period | Source of Growth |
| Full Year 2025 Revenue Outlook (Upper Bound) | $5.445 billion | FY 2025 | AI/GenAI-Native Services |
| Financial Services Vertical Revenue | $314 million | Q1 2025 | Exceptional Vertical Performance |
| Financial Services Vertical Growth | 29.3% | Q1 2025 YoY | Strong Market Share Gains |
| Emerging Verticals Revenue | $221 million | Q1 2025 | Outpacing Organic Growth Rate |
| Emerging Verticals Growth | 22.8% | Q1 2025 YoY | High-Demand Services |
| Raised Full Year Organic Constant Currency Growth Outlook | 4.6% | FY 2025 | Cloud and Data Foundation Engineering |
Stars, by their nature, require substantial investment to maintain their high growth trajectory. EPAM Systems, Inc. is actively investing in its people and platforms to support this demand, evidenced by the fact that over 90% of employees completed mandatory AI literacy education.
The company's commitment to shareholder value, even while investing heavily in Stars, is also visible through capital allocation activities. In the third quarter of 2025, EPAM generated an all-time high free cash flow of $286 million. Additionally, the company announced a new $1 billion share repurchase program.
Key operational metrics supporting the Star positioning include:
- Total Q1 2025 Revenue: $1.302 billion
- Q1 2025 Total Revenue Growth: 11.7% year-over-year
- Non-GAAP Income from Operations Margin: 13.5% in Q1 2025
- Headcount at End of Q1 2025: Approximately 61,700
The success in these high-growth areas is critical, as the overall addressable market for EPAM Systems, Inc.'s services is estimated to reach $2.1 trillion by 2027.
EPAM Systems, Inc. (EPAM) - BCG Matrix: Cash Cows
Cash Cows are the business units or products that hold a high market share in a mature segment, generating more cash than they consume. For EPAM Systems, Inc., these form the stable foundation funding growth initiatives.
Core Digital Engineering and Product Development: EPAM's foundational, high-margin expertise that generates consistent cash flow.
The company's heritage in deep engineering is what underpins its consistent profitability, even as growth shifts toward newer AI-native areas. This core capability translates directly into strong cash generation, evidenced by the overall financial performance.
- Cash provided by operating activities for the first nine months of 2025 reached $372.0 million.
- The company repurchased $82.1 million of stock in Q3 2025 alone.
- Management announced a new share repurchase plan for up to $1 billion in additional repurchases.
North American Operations: The Americas accounted for 58% of Q3 2025 revenue, providing the largest, most stable base of business.
The Americas segment is the primary engine for current top-line performance, offering the scale and stability characteristic of a mature market leader for EPAM Systems, Inc. This region's size makes it a critical component of the cash cow portfolio.
| Metric | Value |
| Q3 2025 Revenue Share (The Americas) | 58% |
| Q3 2025 Reported Growth (The Americas) | 16% |
| Q3 2025 Total Revenue | $1.394 billion |
Application Services: A mature, high-share offering, recognized for top-tier Service Delivery Quality in Europe.
In Europe, where the market for core application development and modernization is established, EPAM Systems, Inc. maintains a leading position. This is not a high-growth area like emerging AI, but it is a high-share, reliable revenue stream.
- Named Top IT Vendor in Europe by Whitelane Research in the 2024/2025 IT Sourcing Study.
- Received a rating of 82% for Application Services in the European study.
- Achieved a rating of 84% for Service Delivery Quality in Europe.
High Non-GAAP Operating Margin: Expected to be 15.0% to 15.3% for 2025, which funds the high-growth investments.
The ability to maintain strong operating margins, even while investing heavily in future growth areas, confirms the cash cow status. These margins represent the high profit generated from established, high-share services.
- Full-year 2025 expected Non-GAAP Operating Margin range: 15.0% to 15.3%.
- Q3 2025 achieved Non-GAAP Operating Margin: 16.0%.
- Full-year 2025 expected revenue growth midpoint: 15.0%.
EPAM Systems, Inc. (EPAM) - BCG Matrix: Dogs
Dogs are business units or services characterized by low market share in low-growth markets. For EPAM Systems, Inc., these units tie up capital without generating significant returns, making divestiture a primary strategic consideration.
Legacy Manual Testing Services represent the foundational work being actively superseded by EPAM Systems, Inc.'s proprietary advancements. The new offering, Agentic QA, is shown to be up to 10x more efficient than the legacy manual testing approach. This efficiency translates to tangible client benefits, including a reported 50% savings in manual efforts and a 30% reduction in testing costs, while covering 90% of the manual checks typically performed on standard releases.
Commodity IT Outsourcing and non-differentiated services fall into markets where price competition is fierce and overall market growth is minimal compared to the company's high-growth segments. This pressure is reflected in the overall company margin compression; the Trailing Twelve Months (TTM) Operating Margin as of November 2025 stands at 10.74%, down from 12.36% at the end of 2024. The GAAP Income from Operations for Q3 2025 was only 10.4% of revenues, suggesting low-value work drags down the blended profitability.
Non-Strategic, Low-Margin Client Accounts are relationships that do not align with the strategic pivot toward high-value, complex engineering, such as AI-native buildouts. While the company reported strong growth in its top 20 clients, increasing 8.8% year-over-year in Q2 2025, revenue from clients outside this top tier grew significantly faster at 23% year-over-year in the same period. This suggests that while the overall client base is growing, the lower-tier, lower-margin accounts may be consuming disproportionate management attention relative to their strategic value.
Services in Geographically Repositioned Areas refer to legacy delivery centers where utilization rates have not fully recovered following necessary repositioning. These centers require capital maintenance even as their contribution to the high-growth narrative diminishes. For context, the Americas region accounted for 58% of Q3 2025 revenue and grew 16% reported, while EMEA grew 24.9% year-over-year in Q3 2025, indicating where resources are being prioritized.
The contrast between the high-growth areas and the implied low-growth/low-margin areas is stark when looking at the vertical performance in Q3 2025:
| Business Area/Vertical | Q3 2025 Reported Revenue Growth (Y/Y) | Q3 2025 Organic Constant Currency Growth (Y/Y) | Implied Margin Profile |
| AI-Native/Data & Cloud Practices | Faster than overall business | Faster than overall business | High |
| Financial Services Vertical | 32.7% | 6.0% | Medium/High |
| Emerging Verticals | 38.9% | 15.1% | High |
| Legacy Manual Testing (Implied) | Declining/Stagnant | Negative/Low Single Digits | Low |
| Commodity/Non-Strategic Services (Implied) | Below 7.1% (Overall Organic) | Below 7.1% (Overall Organic) | Low |
The full-year 2025 revenue guidance midpoint projects 15.0% year-over-year growth, driven by the high-growth areas. The non-GAAP Operating Income margin guidance for Q4 2025 is targeted between 15.5% and 16.5%, which you should compare against the 16.0% achieved in Q3 2025. The GAAP diluted EPS for the full year is guided to a range of $6.75 to $6.83.
- Legacy Manual Testing replacement efficiency: 10x faster.
- Cost savings from Agentic QA: 30% reduction.
- Q3 2025 Total Revenue: $1.394 billion.
- Overall TTM Operating Margin (Nov 2025): 10.74%.
- Total Headcount (Sept 30, 2025): 62,350 professionals.
Finance: draft 13-week cash view by Friday.
EPAM Systems, Inc. (EPAM) - BCG Matrix: Question Marks
QUESTION MARKS (high growth products (brands), low market share):
These parts of a business have high growth prospects but a low market share. They consume a lot of cash but bring little in return. Question Marks lose a company money. However, since these business units are growing rapidly, they have the potential to turn into Stars in a high-growth market. Companies are advised to invest in Question Marks if the products have potential for growth, or to sell if they do not.
You're looking at where EPAM Systems, Inc. is placing big bets for future growth, areas that need cash now to capture market share later. These are the high-potential, low-certainty plays in the portfolio.
New Geographic Delivery Centers
The expansion in India represents a major cash commitment aimed at scaling delivery capacity. EPAM Systems aims to reach 10,000 employees in India by March 2025. This follows hiring over 2,000 employees in India during the calendar year leading up to late 2024. At the end of 2023, EPAM India had 7,050 employees, which was about 13% of the global workforce of 53,000. As of March 31, 2025, the total global headcount was approximately 61,700 professionals.
- Target headcount in India: 10,000 by March 2025.
- India workforce as of late 2024: more than 9,000.
- India headcount at end of 2023: 7,050.
- Global headcount as of March 31, 2025: approximately 61,700.
Recent Strategic Acquisitions
Integrating recent acquisitions requires significant investment to realize potential market share gains. The acquisition of NEORIS closed on November 1, 2024, bringing approximately 4,800 professionals across Latin America, Spain, and the U.S.. The acquisition of First Derivative, which closed on December 3, 2024, added more than 1,800 employees globally, specializing in capital markets. At the time of the NEORIS close in November 2024, EPAM Systems had a market capitalization of $10.76 billion and revenue for the last twelve months stood at $4.62 billion.
These integrations are designed to immediately bolster specific domain expertise, which is a cash-intensive process before revenue synergies materialize.
| Acquisition | Approximate Employee Count Added | Closing Period |
| NEORIS | 4,800 | November 2024 |
| First Derivative | More than 1,800 | December 2024 |
New Proprietary AI Platforms
The investment in new AI offerings is a classic Question Mark play: high potential reward if they capture market share, but significant upfront cost. EPAM Systems launched the AI/Run?. Transform Playbook in October 2025. This is a next-generation integrated consulting service built to boost enterprise-wide AI-native transformation. The success of these investments is beginning to show, as Q3 2025 results reported revenue of $1.394 billion with 19.4% year-over-year growth. However, GAAP operating margins are projected to stay in the 9-10% range for 2025.
- Platform launch: AI/Run?. Transform Playbook in October 2025.
- Q3 2025 Revenue: $1.394 billion.
- Q3 2025 YoY Revenue Growth: 19.4%.
- Projected 2025 GAAP Operating Margin: 9-10%.
APAC Region
The Asia-Pacific (APAC) region shows low current revenue contribution but positive growth, fitting the low market share/high growth market profile. For the first quarter ended March 31, 2025, the revenue from APAC was $25 million. This represented a growth rate of 4.3% year-over-year. Total EPAM Systems revenue for Q1 2025 was $1.302 billion.
| Geographic Region | Q1 2025 Revenue (USD) | Year-over-Year Growth |
| The Americas | $780 million | 12.6% |
| EMEA | $497 million | 10.7% |
| APAC | $25 million | 4.3% |
Disclaimer
All information, articles, and product details provided on this website are for general informational and educational purposes only. We do not claim any ownership over, nor do we intend to infringe upon, any trademarks, copyrights, logos, brand names, or other intellectual property mentioned or depicted on this site. Such intellectual property remains the property of its respective owners, and any references here are made solely for identification or informational purposes, without implying any affiliation, endorsement, or partnership.
We make no representations or warranties, express or implied, regarding the accuracy, completeness, or suitability of any content or products presented. Nothing on this website should be construed as legal, tax, investment, financial, medical, or other professional advice. In addition, no part of this site—including articles or product references—constitutes a solicitation, recommendation, endorsement, advertisement, or offer to buy or sell any securities, franchises, or other financial instruments, particularly in jurisdictions where such activity would be unlawful.
All content is of a general nature and may not address the specific circumstances of any individual or entity. It is not a substitute for professional advice or services. Any actions you take based on the information provided here are strictly at your own risk. You accept full responsibility for any decisions or outcomes arising from your use of this website and agree to release us from any liability in connection with your use of, or reliance upon, the content or products found herein.