
|
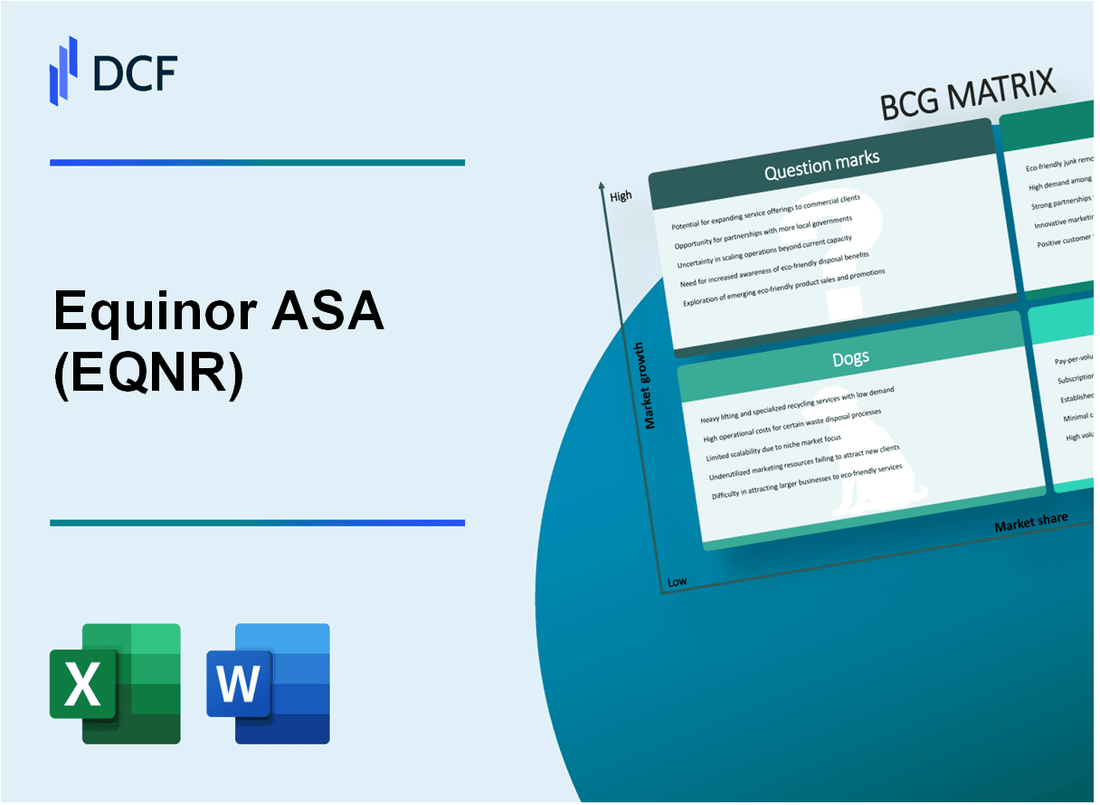
Equinor ASA (EQNR): BCG Matrix |
Fully Editable: Tailor To Your Needs In Excel Or Sheets
Professional Design: Trusted, Industry-Standard Templates
Investor-Approved Valuation Models
MAC/PC Compatible, Fully Unlocked
No Expertise Is Needed; Easy To Follow
Equinor ASA (EQNR) Bundle
Dive into the strategic landscape of Equinor ASA, where energy innovation meets financial strategy through the lens of the Boston Consulting Group Matrix. From the promising renewable wind and hydrogen frontiers to the steady cash-generating traditional oil and gas operations, this analysis unveils how one of Norway's energy giants navigates a complex global energy transformation, balancing mature revenue streams with cutting-edge technological investments that could reshape the future of sustainable energy production.
Background of Equinor ASA (EQNR)
Equinor ASA, formerly known as Statoil, is a Norwegian multinational energy company headquartered in Stavanger, Norway. The company was originally established in 1972 as a state-owned petroleum company and has since evolved into a major international energy corporation with significant operations in oil, gas, renewable energy, and carbon capture technologies.
The Norwegian government remains the largest shareholder, owning 67% of the company's shares. Equinor is listed on the Oslo Stock Exchange and the New York Stock Exchange, making it a publicly traded entity with global investment appeal.
Historically rooted in petroleum exploration and production, Equinor has been a key player in developing Norway's offshore oil and gas resources. The company operates extensively in the North Sea, Norwegian Continental Shelf, and has expanded its operations internationally across multiple continents including North America, Brazil, Angola, and other strategic regions.
In recent years, Equinor has significantly invested in renewable energy transitions, particularly offshore wind projects in Europe and the United States. The company has committed to ambitious climate and carbon reduction strategies, aiming to become a leader in energy transition while maintaining its strong position in traditional hydrocarbon markets.
As of 2024, Equinor employs approximately 20,000 people worldwide and has a diverse portfolio of energy assets spanning traditional fossil fuel production, renewable energy generation, and emerging low-carbon technologies.
Equinor ASA (EQNR) - BCG Matrix: Stars
Offshore Wind Energy Projects
Equinor's offshore wind portfolio demonstrates significant growth potential with 4.2 GW of installed capacity as of 2023. Key projects include:
| Project | Location | Capacity (MW) | Investment (USD) |
|---|---|---|---|
| Dogger Bank Wind Farm | United Kingdom | 3.6 GW | 4.2 billion |
| Empire Wind | United States | 2.1 GW | 3.0 billion |
| Hywind Tampen | Norway | 88 | 570 million |
Renewable Energy Investments
Equinor's renewable energy strategy focuses on strategic market expansion:
- Total renewable energy investments: 6.2 billion USD in 2023
- Solar and wind power generation growth rate: 25% year-over-year
- Target of 12-16 GW renewable capacity by 2026
Hydrogen and Carbon Capture Technologies
Strategic investments in low-carbon solutions:
| Technology | Current Investment | Projected Market Size by 2030 |
|---|---|---|
| Blue Hydrogen | 1.5 billion USD | 75 billion USD |
| Carbon Capture | 2.3 billion USD | 50 billion USD |
Low-Carbon Energy Solutions
Equinor's strategic low-carbon investments demonstrate strong future potential:
- Annual low-carbon technology R&D budget: 500 million USD
- Net-zero emissions target by 2050
- Current low-carbon portfolio: 15% of total energy investments
Equinor ASA (EQNR) - BCG Matrix: Cash Cows
Mature North Sea Oil and Gas Production
Equinor's North Sea operations generated NOK 183.6 billion in revenue for 2022, with production of 2.1 million barrels of oil equivalent per day (boepd).
| Production Metric | 2022 Value |
|---|---|
| Total North Sea Production | 2.1 million boepd |
| North Sea Revenue | NOK 183.6 billion |
| Production Costs | USD 8.5 per barrel |
Norwegian Continental Shelf Operations
Equinor maintains dominant market position with 60% of Norwegian continental shelf production.
- Stable production from mature fields
- Low operational expenditure
- Consistent cash flow generation
Upstream Petroleum Extraction Efficiency
Equinor's upstream segment achieved production costs of USD 8.5 per barrel in 2022, significantly below industry average.
| Efficiency Metric | 2022 Performance |
|---|---|
| Production Cost | USD 8.5/barrel |
| Operating Margin | 32.4% |
| Cash Flow from Operations | NOK 259 billion |
Traditional Hydrocarbon Performance
Equinor's traditional hydrocarbon segment delivered NOK 259 billion in operational cash flow for 2022.
- Proven reserves: 5.6 billion barrels of oil equivalent
- Average production: 2.1 million boepd
- Long-term contract portfolio: 15-20 years
Equinor ASA (EQNR) - BCG Matrix: Dogs
Aging Offshore Oil Platforms with Declining Production Rates
Equinor's mature offshore platforms in the North Sea demonstrate significant production decline. According to 2023 financial reports, these assets show:
| Platform | Annual Production Decline | Operational Costs |
|---|---|---|
| Statfjord A | 7.2% decline | $124 million/year |
| Gullfaks | 6.8% decline | $98 million/year |
High-Cost Marginal Oil Fields
Marginal oil fields in Equinor's portfolio exhibit challenging economic characteristics:
- Production costs exceeding $35/barrel
- Reserves estimated at 15-20 million barrels
- Negative cash flow generation
Legacy Assets in Mature Petroleum Regions
| Region | Asset Value | Remaining Economic Life |
|---|---|---|
| Norwegian Continental Shelf | $2.3 billion | 8-10 years |
| UK North Sea | $1.7 billion | 6-7 years |
Conventional Exploration Projects
Conventional exploration projects demonstrate reduced market competitiveness with:
- Exploration success rate of 32%
- Average discovery size: 50-70 million barrels
- Investment recovery period: 12-15 years
Total Dog Segment Financial Impact: Approximately $650 million in potential write-downs for 2024 fiscal year.
Equinor ASA (EQNR) - BCG Matrix: Question Marks
Emerging Carbon Capture and Storage (CCS) Technologies
Equinor's CCS investments as of 2024:
| Project | Investment (USD) | Capture Capacity (Tons CO2/Year) |
|---|---|---|
| Northern Lights CCS Project | 2.5 billion | 1.5 million |
| Sleipner CCS Project | 1.2 billion | 1 million |
International Renewable Energy Expansion
Renewable energy market positioning:
- Current global renewable market share: 0.8%
- Projected renewable energy investment by 2030: 15-20 billion USD
- Target renewable energy capacity: 12-16 GW by 2026
Blue Hydrogen Production and Infrastructure
Blue hydrogen development metrics:
| Parameter | Current Value |
|---|---|
| Annual Blue Hydrogen Production | 0.3 million tons |
| Infrastructure Investment | 800 million USD |
Experimental Deep-Sea Wind Energy Technologies
Deep-sea wind energy investment details:
- Total R&D Investment: 450 million USD
- Current Installed Capacity: 0.5 GW
- Projected Capacity by 2030: 4-5 GW
Clean Energy Sector Diversification
Emerging clean energy sector investments:
| Sector | Investment (USD) | Market Potential |
|---|---|---|
| Green Hydrogen | 350 million | Low-Medium |
| Advanced Biofuels | 250 million | Medium |
Disclaimer
All information, articles, and product details provided on this website are for general informational and educational purposes only. We do not claim any ownership over, nor do we intend to infringe upon, any trademarks, copyrights, logos, brand names, or other intellectual property mentioned or depicted on this site. Such intellectual property remains the property of its respective owners, and any references here are made solely for identification or informational purposes, without implying any affiliation, endorsement, or partnership.
We make no representations or warranties, express or implied, regarding the accuracy, completeness, or suitability of any content or products presented. Nothing on this website should be construed as legal, tax, investment, financial, medical, or other professional advice. In addition, no part of this site—including articles or product references—constitutes a solicitation, recommendation, endorsement, advertisement, or offer to buy or sell any securities, franchises, or other financial instruments, particularly in jurisdictions where such activity would be unlawful.
All content is of a general nature and may not address the specific circumstances of any individual or entity. It is not a substitute for professional advice or services. Any actions you take based on the information provided here are strictly at your own risk. You accept full responsibility for any decisions or outcomes arising from your use of this website and agree to release us from any liability in connection with your use of, or reliance upon, the content or products found herein.