
|
Eris Lifesciences Limited (ERIS.NS) DCF Valuation |
Fully Editable: Tailor To Your Needs In Excel Or Sheets
Professional Design: Trusted, Industry-Standard Templates
Investor-Approved Valuation Models
MAC/PC Compatible, Fully Unlocked
No Expertise Is Needed; Easy To Follow
Eris Lifesciences Limited (ERIS.NS) Bundle
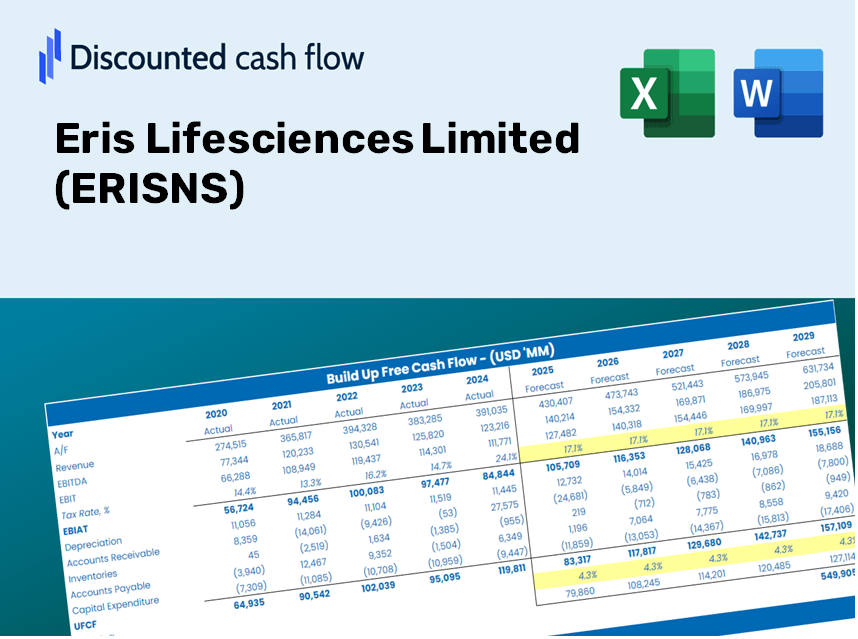
Evaluate Eris Lifesciences Limited's financial prospects with expertise! This (ERISNS) DCF Calculator provides you with pre-filled financial data and the flexibility to modify revenue growth, WACC, margins, and other essential assumptions to align with your projections.
Discounted Cash Flow (DCF) - (USD MM)
| Year | AY1 2021 |
AY2 2022 |
AY3 2023 |
AY4 2024 |
AY5 2025 |
FY1 2026 |
FY2 2027 |
FY3 2028 |
FY4 2029 |
FY5 2030 |
|---|---|---|---|---|---|---|---|---|---|---|
| Revenue | 11,926.4 | 13,261.7 | 16,618.2 | 19,913.0 | 28,792.6 | 36,057.3 | 45,154.9 | 56,547.9 | 70,815.5 | 88,683.0 |
| Revenue Growth, % | 0 | 11.2 | 25.31 | 19.83 | 44.59 | 25.23 | 25.23 | 25.23 | 25.23 | 25.23 |
| EBITDA | 4,394.6 | 5,111.2 | 5,480.8 | 6,986.5 | 10,172.0 | 12,892.8 | 16,145.8 | 20,219.6 | 25,321.2 | 31,709.9 |
| EBITDA, % | 36.85 | 38.54 | 32.98 | 35.08 | 35.33 | 35.76 | 35.76 | 35.76 | 35.76 | 35.76 |
| Depreciation | 429.9 | 647.1 | 1,170.9 | 1,826.1 | 3,154.6 | 2,571.3 | 3,220.0 | 4,032.5 | 5,049.9 | 6,324.1 |
| Depreciation, % | 3.6 | 4.88 | 7.05 | 9.17 | 10.96 | 7.13 | 7.13 | 7.13 | 7.13 | 7.13 |
| EBIT | 3,964.7 | 4,464.2 | 4,309.9 | 5,160.4 | 7,017.4 | 10,321.5 | 12,925.8 | 16,187.1 | 20,271.2 | 25,385.9 |
| EBIT, % | 33.24 | 33.66 | 25.93 | 25.91 | 24.37 | 28.63 | 28.63 | 28.63 | 28.63 | 28.63 |
| Total Cash | 1,307.0 | 2,123.2 | 892.4 | 13,388.5 | 2,278.3 | 7,751.4 | 9,707.1 | 12,156.3 | 15,223.5 | 19,064.6 |
| Total Cash, percent | .0 | .0 | .0 | .0 | .0 | .0 | .0 | .0 | .0 | .0 |
| Account Receivables | 1,467.4 | 2,089.4 | 2,927.1 | 4,220.2 | 4,586.4 | 5,970.7 | 7,477.2 | 9,363.8 | 11,726.4 | 14,685.0 |
| Account Receivables, % | 12.3 | 15.75 | 17.61 | 21.19 | 15.93 | 16.56 | 16.56 | 16.56 | 16.56 | 16.56 |
| Inventories | 944.7 | 1,179.1 | 1,314.4 | 1,890.3 | 3,348.3 | 3,305.9 | 4,140.1 | 5,184.6 | 6,492.8 | 8,131.0 |
| Inventories, % | 7.92 | 8.89 | 7.91 | 9.49 | 11.63 | 9.17 | 9.17 | 9.17 | 9.17 | 9.17 |
| Accounts Payable | 1,026.2 | 1,177.7 | 1,247.7 | 2,683.5 | 3,323.5 | 3,606.6 | 4,516.6 | 5,656.1 | 7,083.2 | 8,870.4 |
| Accounts Payable, % | 8.6 | 8.88 | 7.51 | 13.48 | 11.54 | 10 | 10 | 10 | 10 | 10 |
| Capital Expenditure | -257.6 | -1,210.3 | -8,414.2 | -1,291.6 | -1,550.0 | -5,321.3 | -6,663.9 | -8,345.2 | -10,450.8 | -13,087.6 |
| Capital Expenditure, % | -2.16 | -9.13 | -50.63 | -6.49 | -5.38 | -14.76 | -14.76 | -14.76 | -14.76 | -14.76 |
| Tax Rate, % | 28.03 | 28.03 | 28.03 | 28.03 | 28.03 | 28.03 | 28.03 | 28.03 | 28.03 | 28.03 |
| EBITAT | 3,569.1 | 4,099.9 | 4,070.4 | 4,690.6 | 5,050.4 | 9,065.9 | 11,353.3 | 14,217.8 | 17,805.1 | 22,297.5 |
| Depreciation | ||||||||||
| Changes in Account Receivables | ||||||||||
| Changes in Inventories | ||||||||||
| Changes in Accounts Payable | ||||||||||
| Capital Expenditure | ||||||||||
| UFCF | 2,355.4 | 2,831.8 | -4,075.9 | 4,791.7 | 5,470.9 | 5,257.0 | 6,478.8 | 8,113.5 | 10,160.6 | 12,724.3 |
| WACC, % | 5.04 | 5.06 | 5.09 | 5.05 | 4.87 | 5.02 | 5.02 | 5.02 | 5.02 | 5.02 |
| PV UFCF | ||||||||||
| SUM PV UFCF | 36,194.2 | |||||||||
| Long Term Growth Rate, % | 4.00 | |||||||||
| Free cash flow (T + 1) | 13,233 | |||||||||
| Terminal Value | 1,293,403 | |||||||||
| Present Terminal Value | 1,012,299 | |||||||||
| Enterprise Value | 1,048,493 | |||||||||
| Net Debt | 22,551 | |||||||||
| Equity Value | 1,025,943 | |||||||||
| Diluted Shares Outstanding, MM | 136 | |||||||||
| Equity Value Per Share | 7,526.04 |
What You Will Receive
- Editable Excel Template: A fully customizable Excel-based DCF Calculator featuring pre-filled real financials for Eris Lifesciences Limited (ERISNS).
- Real-World Data: Access to historical data and forward-looking estimates (highlighted in the yellow cells).
- Forecast Flexibility: Adjust forecast assumptions such as revenue growth, EBITDA %, and WACC to suit your analysis.
- Automatic Calculations: Quickly assess the impact of your inputs on the valuation of Eris Lifesciences Limited (ERISNS).
- Professional Tool: Designed for use by investors, CFOs, consultants, and financial analysts.
- User-Friendly Design: Organized for clarity and ease of use, complete with step-by-step guidance.
Key Features
- Comprehensive Historical Data: Access Eris Lifesciences Limited's (ERISNS) financial statements and pre-populated forecasts.
- Customizable Parameters: Adjust WACC, tax rates, revenue growth, and EBITDA margins to fit your analysis.
- Real-Time Insights: Watch as Eris Lifesciences Limited's (ERISNS) intrinsic value updates instantly.
- Intuitive Visual Representations: Dashboard visuals showcase valuation outcomes and essential metrics.
- Precision-Driven Design: A reliable resource tailored for analysts, investors, and finance professionals.
How It Operates
- Step 1: Download the Excel spreadsheet.
- Step 2: Examine the pre-filled data for Eris Lifesciences Limited (ERISNS) including historical and projected figures.
- Step 3: Modify the key assumptions (highlighted in yellow) according to your analysis.
- Step 4: Observe the automatic recalculations for the intrinsic value of Eris Lifesciences Limited (ERISNS).
- Step 5: Utilize the results for informed investment decisions or reporting purposes.
Why Choose This Calculator for Eris Lifesciences Limited (ERISNS)?
- User-Friendly Design: Tailored for both novice and experienced users.
- Customizable Inputs: Effortlessly adjust parameters to suit your analysis needs.
- Real-Time Updates: Observe immediate changes in Eris Lifesciences' valuation as you modify inputs.
- Pre-Loaded Data: Comes equipped with Eris Lifesciences' actual financial information for swift assessments.
- Endorsed by Experts: Utilized by investors and analysts for making well-informed choices.
Who Can Benefit from This Product?
- Investors: Evaluate Eris Lifesciences Limited's (ERISNS) valuation prior to making stock trades.
- CFOs and Financial Analysts: Enhance valuation methodologies and validate financial projections.
- Startup Founders: Gain insights into how leading public companies like Eris Lifesciences Limited are appraised.
- Consultants: Generate comprehensive valuation reports for your clientele.
- Students and Educators: Apply real data to refine and teach valuation strategies.
Contents of the Template
- Pre-Filled Data: Contains Eris Lifesciences Limited's historical financials and projections.
- Discounted Cash Flow Model: An editable DCF valuation model featuring automatic calculations.
- Weighted Average Cost of Capital (WACC): A specific sheet designed for calculating WACC using custom inputs.
- Key Financial Ratios: Assess Eris Lifesciences' profitability, efficiency, and leverage.
- Customizable Inputs: Easily adjust revenue growth, margins, and tax rates.
- Clear Dashboard: Visual representations and tables summarizing essential valuation outcomes.
Disclaimer
All information, articles, and product details provided on this website are for general informational and educational purposes only. We do not claim any ownership over, nor do we intend to infringe upon, any trademarks, copyrights, logos, brand names, or other intellectual property mentioned or depicted on this site. Such intellectual property remains the property of its respective owners, and any references here are made solely for identification or informational purposes, without implying any affiliation, endorsement, or partnership.
We make no representations or warranties, express or implied, regarding the accuracy, completeness, or suitability of any content or products presented. Nothing on this website should be construed as legal, tax, investment, financial, medical, or other professional advice. In addition, no part of this site—including articles or product references—constitutes a solicitation, recommendation, endorsement, advertisement, or offer to buy or sell any securities, franchises, or other financial instruments, particularly in jurisdictions where such activity would be unlawful.
All content is of a general nature and may not address the specific circumstances of any individual or entity. It is not a substitute for professional advice or services. Any actions you take based on the information provided here are strictly at your own risk. You accept full responsibility for any decisions or outcomes arising from your use of this website and agree to release us from any liability in connection with your use of, or reliance upon, the content or products found herein.