
|
Essex Property Trust, Inc. (ESS) DCF Valuation |
Fully Editable: Tailor To Your Needs In Excel Or Sheets
Professional Design: Trusted, Industry-Standard Templates
Investor-Approved Valuation Models
MAC/PC Compatible, Fully Unlocked
No Expertise Is Needed; Easy To Follow
Essex Property Trust, Inc. (ESS) Bundle
Enhance your investment choices with the Essex Property Trust, Inc. (ESS) DCF Calculator! Explore real financial data for Essex Property Trust, adjust growth projections and expenses, and instantly observe how these alterations affect the intrinsic value of (ESS).
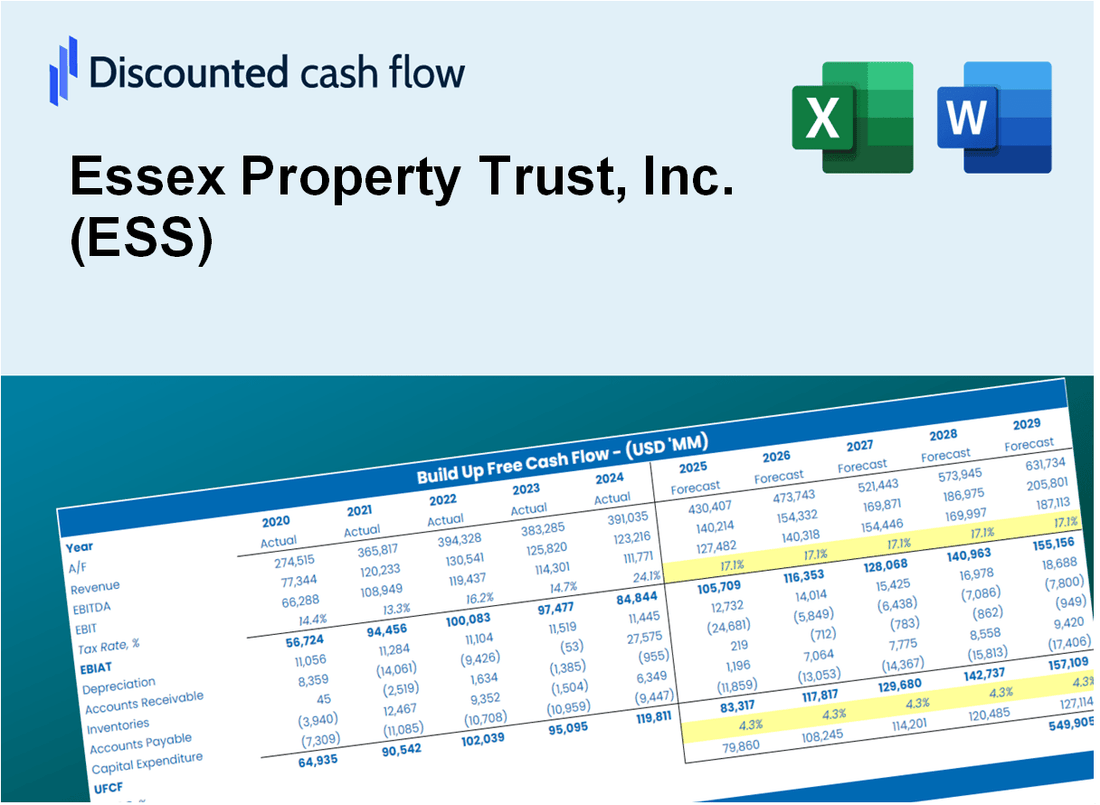
Discounted Cash Flow (DCF) - (USD MM)
| Year | AY1 2020 |
AY2 2021 |
AY3 2022 |
AY4 2023 |
AY5 2024 |
FY1 2025 |
FY2 2026 |
FY3 2027 |
FY4 2028 |
FY5 2029 |
|---|---|---|---|---|---|---|---|---|---|---|
| Revenue | 1,495.7 | 1,440.6 | 1,606.8 | 1,669.4 | 1,774.5 | 1,854.5 | 1,938.1 | 2,025.5 | 2,116.9 | 2,212.3 |
| Revenue Growth, % | 0 | -3.69 | 11.54 | 3.89 | 6.29 | 4.51 | 4.51 | 4.51 | 4.51 | 4.51 |
| EBITDA | 1,610.4 | 1,503.8 | 1,196.1 | 1,192.1 | 1,627.1 | 1,622.8 | 1,696.0 | 1,772.5 | 1,852.4 | 1,936.0 |
| EBITDA, % | 107.66 | 104.39 | 74.44 | 71.41 | 91.69 | 87.51 | 87.51 | 87.51 | 87.51 | 87.51 |
| Depreciation | 525.5 | 520.1 | 539.3 | 548.4 | 580.2 | 631.8 | 660.3 | 690.1 | 721.2 | 753.7 |
| Depreciation, % | 35.13 | 36.1 | 33.56 | 32.85 | 32.7 | 34.07 | 34.07 | 34.07 | 34.07 | 34.07 |
| EBIT | 1,084.9 | 983.7 | 656.8 | 643.6 | 1,046.8 | 1,035.7 | 1,082.4 | 1,131.2 | 1,182.2 | 1,235.5 |
| EBIT, % | 72.53 | 68.29 | 40.88 | 38.55 | 58.99 | 55.85 | 55.85 | 55.85 | 55.85 | 55.85 |
| Total Cash | 221.4 | 240.2 | 146.0 | 479.5 | 136.6 | 285.6 | 298.4 | 311.9 | 326.0 | 340.7 |
| Total Cash, percent | .0 | .0 | .0 | .0 | .0 | .0 | .0 | .0 | .0 | .0 |
| Account Receivables | 195.1 | 341.0 | 103.0 | 174.6 | 206.7 | 242.0 | 252.9 | 264.3 | 276.2 | 288.7 |
| Account Receivables, % | 13.04 | 23.67 | 6.41 | 10.46 | 11.65 | 13.05 | 13.05 | 13.05 | 13.05 | 13.05 |
| Inventories | 57.9 | .0 | .0 | .0 | .0 | 14.4 | 15.0 | 15.7 | 16.4 | 17.1 |
| Inventories, % | 3.87 | 0 | 0 | 0 | 0 | 0.7747 | 0.7747 | 0.7747 | 0.7747 | 0.7747 |
| Accounts Payable | 152.9 | 180.8 | 165.5 | 176.4 | 212.7 | 206.3 | 215.6 | 225.3 | 235.5 | 246.1 |
| Accounts Payable, % | 10.22 | 12.55 | 10.3 | 10.57 | 11.99 | 11.12 | 11.12 | 11.12 | 11.12 | 11.12 |
| Capital Expenditure | -90.1 | -121.2 | -163.2 | -140.4 | -136.4 | -150.9 | -157.7 | -164.8 | -172.3 | -180.0 |
| Capital Expenditure, % | -6.02 | -8.41 | -10.16 | -8.41 | -7.69 | -8.14 | -8.14 | -8.14 | -8.14 | -8.14 |
| Tax Rate, % | 8.6 | 8.6 | 8.6 | 8.6 | 8.6 | 8.6 | 8.6 | 8.6 | 8.6 | 8.6 |
| EBITAT | 714.1 | 615.7 | 619.4 | 606.4 | 956.8 | 845.8 | 884.0 | 923.8 | 965.5 | 1,009.0 |
| Depreciation | ||||||||||
| Changes in Account Receivables | ||||||||||
| Changes in Inventories | ||||||||||
| Changes in Accounts Payable | ||||||||||
| Capital Expenditure | ||||||||||
| UFCF | 1,049.3 | 954.5 | 1,218.2 | 953.9 | 1,404.9 | 1,270.6 | 1,384.3 | 1,446.7 | 1,512.0 | 1,580.2 |
| WACC, % | 6.09 | 6.06 | 6.4 | 6.4 | 6.37 | 6.26 | 6.26 | 6.26 | 6.26 | 6.26 |
| PV UFCF | ||||||||||
| SUM PV UFCF | 5,979.3 | |||||||||
| Long Term Growth Rate, % | 4.00 | |||||||||
| Free cash flow (T + 1) | 1,643 | |||||||||
| Terminal Value | 72,583 | |||||||||
| Present Terminal Value | 53,567 | |||||||||
| Enterprise Value | 59,546 | |||||||||
| Net Debt | 6,587 | |||||||||
| Equity Value | 52,959 | |||||||||
| Diluted Shares Outstanding, MM | 64 | |||||||||
| Equity Value Per Share | 824.25 |
What You Will Get
- Pre-Filled Financial Model: Essex Property Trust's actual data allows for accurate DCF valuation.
- Full Forecast Control: Modify rental growth, operating margins, WACC, and other essential factors.
- Instant Calculations: Real-time updates ensure you see results immediately as adjustments are made.
- Investor-Ready Template: A polished Excel file crafted for high-quality valuation presentations.
- Customizable and Reusable: Designed for adaptability, enabling repeated use for comprehensive forecasts.
Key Features
- Comprehensive Financial Data: Gain access to reliable pre-loaded historical figures and future forecasts for Essex Property Trust, Inc. (ESS).
- Adjustable Forecast Parameters: Modify highlighted cells for inputs such as WACC, growth rates, and profit margins.
- Real-Time Calculations: Automatic updates for DCF, Net Present Value (NPV), and cash flow assessments.
- User-Friendly Dashboard: Intuitive charts and summaries to help you visualize your valuation findings.
- Suitable for All Levels: A straightforward, user-friendly layout designed for investors, CFOs, and consultants alike.
How It Works
- Step 1: Download the prebuilt Excel template with Essex Property Trust, Inc. (ESS) data included.
- Step 2: Explore the pre-filled sheets and familiarize yourself with the key metrics.
- Step 3: Update forecasts and assumptions in the editable yellow cells (WACC, growth, margins).
- Step 4: Instantly view recalculated results, including Essex Property Trust, Inc. (ESS) intrinsic value.
- Step 5: Make informed investment decisions or generate reports using the outputs.
Why Choose This Calculator for Essex Property Trust, Inc. (ESS)?
- Comprehensive Tool: Features DCF, WACC, and financial ratio analyses tailored for real estate investments.
- Customizable Inputs: Modify yellow-highlighted cells to explore different investment scenarios.
- Detailed Insights: Automatically calculates Essex Property Trust’s intrinsic value and Net Present Value.
- Preloaded Data: Historical and projected data provide reliable foundations for analysis.
- Professional Quality: Perfect for real estate analysts, investors, and property consultants.
Who Should Use This Product?
- Real Estate Students: Understand property valuation methods and apply them to real estate data.
- Academics: Utilize industry-standard models in your research or teaching materials.
- Investors: Validate your investment strategies and evaluate the valuation metrics for Essex Property Trust, Inc. (ESS).
- Analysts: Enhance your analysis with a customizable DCF model tailored for real estate investments.
- Property Managers: Learn how large real estate firms like Essex Property Trust, Inc. (ESS) are valued in the market.
What the Template Contains
- Comprehensive DCF Model: Editable template featuring detailed valuation calculations for Essex Property Trust, Inc. (ESS).
- Real-World Data: Essex’s historical and projected financials preloaded for thorough analysis.
- Customizable Parameters: Adjust WACC, growth rates, and tax assumptions to explore various scenarios.
- Financial Statements: Complete annual and quarterly breakdowns for enhanced insights.
- Key Ratios: Integrated analysis for profitability, efficiency, and leverage metrics.
- Dashboard with Visual Outputs: Charts and tables designed for clear, actionable results.
Disclaimer
All information, articles, and product details provided on this website are for general informational and educational purposes only. We do not claim any ownership over, nor do we intend to infringe upon, any trademarks, copyrights, logos, brand names, or other intellectual property mentioned or depicted on this site. Such intellectual property remains the property of its respective owners, and any references here are made solely for identification or informational purposes, without implying any affiliation, endorsement, or partnership.
We make no representations or warranties, express or implied, regarding the accuracy, completeness, or suitability of any content or products presented. Nothing on this website should be construed as legal, tax, investment, financial, medical, or other professional advice. In addition, no part of this site—including articles or product references—constitutes a solicitation, recommendation, endorsement, advertisement, or offer to buy or sell any securities, franchises, or other financial instruments, particularly in jurisdictions where such activity would be unlawful.
All content is of a general nature and may not address the specific circumstances of any individual or entity. It is not a substitute for professional advice or services. Any actions you take based on the information provided here are strictly at your own risk. You accept full responsibility for any decisions or outcomes arising from your use of this website and agree to release us from any liability in connection with your use of, or reliance upon, the content or products found herein.