
|
EVI Industries, Inc. (EVI) DCF Valuation |
Fully Editable: Tailor To Your Needs In Excel Or Sheets
Professional Design: Trusted, Industry-Standard Templates
Investor-Approved Valuation Models
MAC/PC Compatible, Fully Unlocked
No Expertise Is Needed; Easy To Follow
EVI Industries, Inc. (EVI) Bundle
Evaluate EVI Industries, Inc.'s financial outlook like an expert! This (EVI) DCF Calculator provides pre-loaded financial data along with the flexibility to modify revenue growth, WACC, margins, and other critical assumptions to align with your projections.
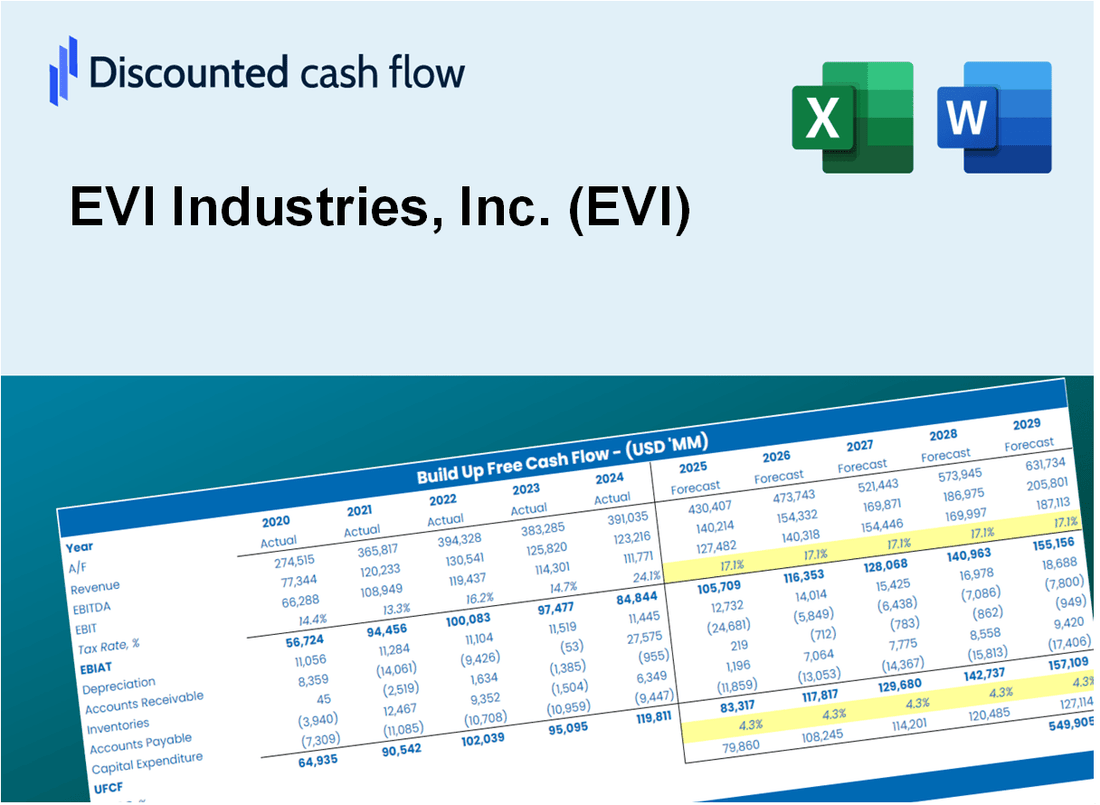
Discounted Cash Flow (DCF) - (USD MM)
| Year | AY1 2021 |
AY2 2022 |
AY3 2023 |
AY4 2024 |
AY5 2025 |
FY1 2026 |
FY2 2027 |
FY3 2028 |
FY4 2029 |
FY5 2030 |
|---|---|---|---|---|---|---|---|---|---|---|
| Revenue | 242.0 | 267.3 | 354.2 | 353.6 | 389.8 | 441.5 | 500.1 | 566.4 | 641.5 | 726.5 |
| Revenue Growth, % | 0 | 10.46 | 32.49 | -0.17223 | 10.26 | 13.26 | 13.26 | 13.26 | 13.26 | 13.26 |
| EBITDA | 15.2 | 11.8 | 22.5 | 17.6 | 20.8 | 24.1 | 27.3 | 31.0 | 35.1 | 39.7 |
| EBITDA, % | 6.27 | 4.4 | 6.36 | 4.98 | 5.33 | 5.47 | 5.47 | 5.47 | 5.47 | 5.47 |
| Depreciation | 4.7 | 5.2 | 6.0 | 6.0 | 6.7 | 7.9 | 9.0 | 10.2 | 11.5 | 13.0 |
| Depreciation, % | 1.92 | 1.95 | 1.7 | 1.69 | 1.72 | 1.8 | 1.8 | 1.8 | 1.8 | 1.8 |
| EBIT | 10.5 | 6.5 | 16.5 | 11.6 | 14.1 | 16.2 | 18.4 | 20.8 | 23.5 | 26.7 |
| EBIT, % | 4.35 | 2.45 | 4.66 | 3.29 | 3.61 | 3.67 | 3.67 | 3.67 | 3.67 | 3.67 |
| Total Cash | 6.1 | 4.0 | 5.9 | 4.6 | 8.9 | 8.1 | 9.2 | 10.4 | 11.8 | 13.4 |
| Total Cash, percent | .0 | .0 | .0 | .0 | .0 | .0 | .0 | .0 | .0 | .0 |
| Account Receivables | 30.7 | 47.7 | 51.9 | 44.6 | 62.6 | 65.2 | 73.9 | 83.7 | 94.8 | 107.3 |
| Account Receivables, % | 12.69 | 17.84 | 14.66 | 12.62 | 16.05 | 14.77 | 14.77 | 14.77 | 14.77 | 14.77 |
| Inventories | 25.1 | 49.4 | 59.2 | 47.9 | .0 | 52.2 | 59.1 | 66.9 | 75.8 | 85.9 |
| Inventories, % | 10.38 | 18.46 | 16.71 | 13.55 | 0 | 11.82 | 11.82 | 11.82 | 11.82 | 11.82 |
| Accounts Payable | 20.7 | 30.8 | 26.7 | 23.1 | 37.9 | 38.7 | 43.9 | 49.7 | 56.3 | 63.8 |
| Accounts Payable, % | 8.54 | 11.54 | 7.54 | 6.53 | 9.73 | 8.78 | 8.78 | 8.78 | 8.78 | 8.78 |
| Capital Expenditure | -2.8 | -4.0 | -3.7 | -4.9 | -4.9 | -5.6 | -6.3 | -7.2 | -8.1 | -9.2 |
| Capital Expenditure, % | -1.17 | -1.49 | -1.05 | -1.38 | -1.25 | -1.27 | -1.27 | -1.27 | -1.27 | -1.27 |
| Tax Rate, % | 31.99 | 31.99 | 31.99 | 31.99 | 31.99 | 31.99 | 31.99 | 31.99 | 31.99 | 31.99 |
| EBITAT | 8.9 | 4.7 | 11.5 | 7.4 | 9.6 | 11.6 | 13.1 | 14.9 | 16.8 | 19.1 |
| Depreciation | ||||||||||
| Changes in Account Receivables | ||||||||||
| Changes in Inventories | ||||||||||
| Changes in Accounts Payable | ||||||||||
| Capital Expenditure | ||||||||||
| UFCF | -24.4 | -25.1 | -4.4 | 23.5 | 56.2 | -40.1 | 5.3 | 6.1 | 6.9 | 7.8 |
| WACC, % | 5.14 | 5.04 | 5.02 | 4.98 | 5.01 | 5.04 | 5.04 | 5.04 | 5.04 | 5.04 |
| PV UFCF | ||||||||||
| SUM PV UFCF | -16.4 | |||||||||
| Long Term Growth Rate, % | 2.00 | |||||||||
| Free cash flow (T + 1) | 8 | |||||||||
| Terminal Value | 261 | |||||||||
| Present Terminal Value | 204 | |||||||||
| Enterprise Value | 187 | |||||||||
| Net Debt | 12 | |||||||||
| Equity Value | 176 | |||||||||
| Diluted Shares Outstanding, MM | 13 | |||||||||
| Equity Value Per Share | 13.35 |
What You Will Get
- Real EVI Financials: Access to historical and projected data for precise valuation.
- Customizable Inputs: Adjust WACC, tax rates, revenue growth, and capital expenditures as needed.
- Automatic Calculations: Dynamic calculation of intrinsic value and NPV.
- Scenario Analysis: Evaluate various scenarios to assess EVI’s future performance.
- User-Friendly Design: Designed for professionals while remaining easy to use for beginners.
Key Features
- Customizable Financial Inputs: Adjust essential metrics such as revenue growth, EBITDA %, and capital expenditures for EVI Industries, Inc. (EVI).
- Instant DCF Valuation: Quickly computes intrinsic value, NPV, and other financial outputs for informed decision-making.
- Highly Accurate Projections: Leverages EVI's actual financial data to ensure realistic valuation results.
- Effortless Scenario Analysis: Easily evaluate various assumptions and analyze different outcomes.
- Efficiency Booster: Streamline the valuation process by avoiding the construction of intricate models from the ground up.
How It Works
- Download: Obtain the pre-configured Excel file featuring EVI Industries, Inc. (EVI)’s financial data.
- Customize: Modify projections, including revenue growth, EBITDA %, and WACC.
- Update Automatically: The intrinsic value and NPV calculations refresh in real-time.
- Test Scenarios: Generate multiple forecasts and instantly compare results.
- Make Decisions: Leverage the valuation insights to inform your investment strategy.
Why Choose This Calculator for EVI Industries, Inc. (EVI)?
- Accurate Data: Real EVI financials ensure reliable valuation results.
- Customizable: Adjust key parameters like growth rates, WACC, and tax rates to fit your projections.
- Time-Saving: Pre-built calculations streamline the process, saving you time.
- Professional-Grade Tool: Tailored for investors, analysts, and consultants in the EVI sector.
- User-Friendly: Intuitive design and step-by-step guidance make it accessible for all users.
Who Should Use EVI Industries, Inc. (EVI)?
- Investors: Gain insights and make informed decisions with EVI's industry-leading solutions.
- Financial Analysts: Streamline your analysis process with EVI's comprehensive financial tools.
- Consultants: Effortlessly customize EVI's resources for impactful client presentations and reports.
- Finance Enthusiasts: Enhance your knowledge of the industry by exploring EVI's innovative practices.
- Educators and Students: Utilize EVI's materials as a valuable resource in finance and business education.
What the Template Contains
- Pre-Filled Data: Includes EVI Industries, Inc. (EVI)'s historical financials and forecasts.
- Discounted Cash Flow Model: Editable DCF valuation model with automatic calculations.
- Weighted Average Cost of Capital (WACC): A dedicated sheet for calculating WACC based on custom inputs.
- Key Financial Ratios: Analyze EVI Industries, Inc. (EVI)'s profitability, efficiency, and leverage.
- Customizable Inputs: Edit revenue growth, margins, and tax rates with ease.
- Clear Dashboard: Charts and tables summarizing key valuation results.
Disclaimer
All information, articles, and product details provided on this website are for general informational and educational purposes only. We do not claim any ownership over, nor do we intend to infringe upon, any trademarks, copyrights, logos, brand names, or other intellectual property mentioned or depicted on this site. Such intellectual property remains the property of its respective owners, and any references here are made solely for identification or informational purposes, without implying any affiliation, endorsement, or partnership.
We make no representations or warranties, express or implied, regarding the accuracy, completeness, or suitability of any content or products presented. Nothing on this website should be construed as legal, tax, investment, financial, medical, or other professional advice. In addition, no part of this site—including articles or product references—constitutes a solicitation, recommendation, endorsement, advertisement, or offer to buy or sell any securities, franchises, or other financial instruments, particularly in jurisdictions where such activity would be unlawful.
All content is of a general nature and may not address the specific circumstances of any individual or entity. It is not a substitute for professional advice or services. Any actions you take based on the information provided here are strictly at your own risk. You accept full responsibility for any decisions or outcomes arising from your use of this website and agree to release us from any liability in connection with your use of, or reliance upon, the content or products found herein.