
|
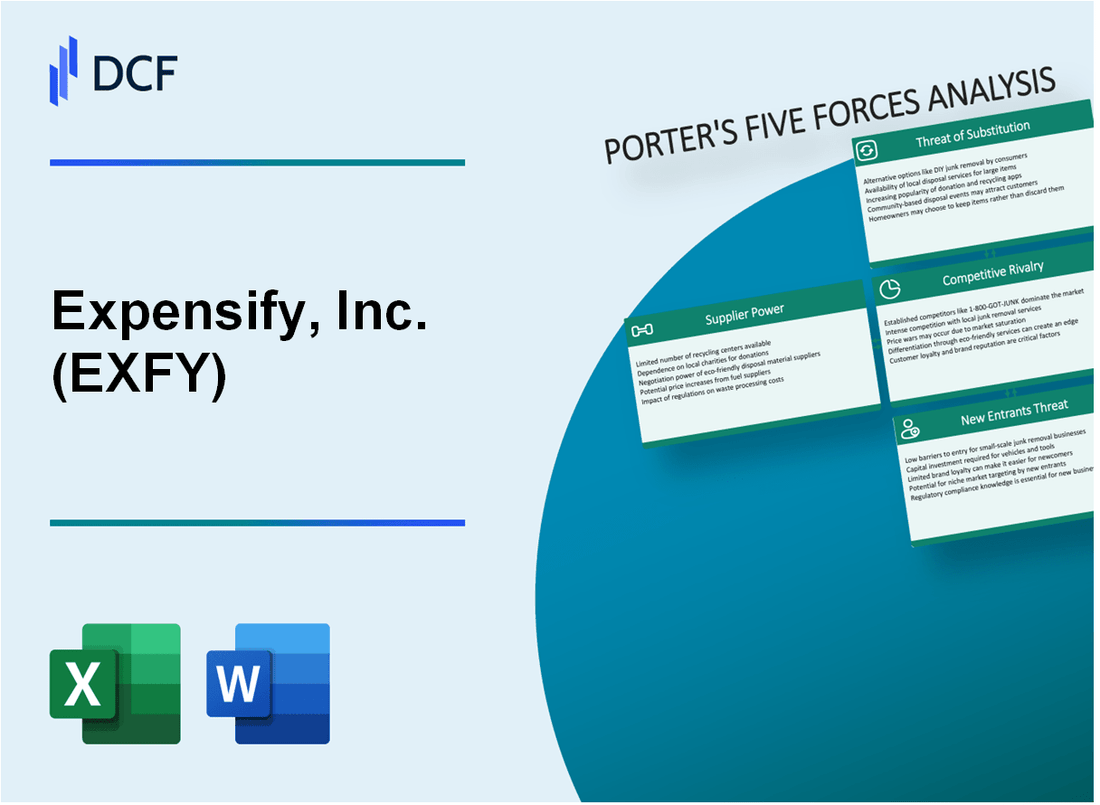
Expensify, Inc. (EXFY): 5 FORCES Analysis [Nov-2025 Updated] |
Fully Editable: Tailor To Your Needs In Excel Or Sheets
Professional Design: Trusted, Industry-Standard Templates
Investor-Approved Valuation Models
MAC/PC Compatible, Fully Unlocked
No Expertise Is Needed; Easy To Follow
Expensify, Inc. (EXFY) Bundle
You're looking at a company in a high-stakes transition, pivoting from a core expense report tool to a payments superapp, which is a major strategic risk. Their ability to execute on the 'New Expensify' migration is everything. Honestly, the numbers from late 2025 tell a tense story: paid members dropped to 642,000 in Q3, signaling that customer power is definitely high in this competitive space against rivals like SAP Concur and Brex. With TTM revenue around $143.91 million, Expensify is fighting hard, even as interchange revenue grows 18% year-over-year to $5.4 million. To truly map out where this leaves the business-balancing supplier leverage against the threat of new entrants needing massive capital to match their bank integrations-we need to break down the competitive landscape using Porter's Five Forces framework below.
Expensify, Inc. (EXFY) - Porter's Five Forces: Bargaining power of suppliers
When you look at the supply side for Expensify, Inc., you are really looking at the foundational plumbing of modern finance and cloud technology. The power these suppliers hold directly impacts Expensify's cost structure and its ability to deliver its core value proposition.
Suppliers of core financial infrastructure, like card networks and banks, hold moderate power. Expensify's strategy is to be bank-agnostic, which theoretically lowers the power of any single bank, but the reliance on the payment rails themselves-Visa U.S.A. Inc. and the issuing bank-is non-negotiable for the Expensify Card product. For instance, the Expensify Visa Commercial Card is issued by The Bancorp Bank, N.A., Member FDIC, pursuant to a license from Visa U.S.A. Inc.. While Expensify captures interchange revenue, which grew to $5.4 million in Q3 2025 (an 18% year-over-year increase), the underlying network fees and bank partnership terms are critical leverage points for those suppliers.
Expensify relies on third-party accounting system integrations (e.g., QuickBooks, Xero) to maintain its value proposition. This ecosystem dependency is a double-edged sword. Expensify offers integrations with QuickBooks, Xero, NetSuite, Sage Intacct, ADP, and Gusto, among over 45 other platforms. This broad compatibility is a strength for Expensify, but it means the major accounting software providers retain power because CFOs in 2025 are actively seeking solutions that complement, rather than replace, their existing general ledger systems.
The company's proprietary 'Concierge AI' reduces reliance on human customer support vendors. This internal development directly counters supplier power in the service layer. As of March 2025, AI-powered automation had already reduced customer support escalations by 80% and cut SmartScan processing costs by 75%. The latest iteration is a hybrid agent, blending advanced AI with 24/7 human expertise, meaning the need to outsource high volumes of routine support is structurally diminished.
Technology suppliers for cloud hosting and development tools are commoditized, limiting their leverage. For a SaaS company like Expensify, cloud infrastructure is a major operational expense. While the global public cloud market is dominated by Amazon Web Services (with a 32% market share), Microsoft Azure (23% share), and Google Cloud (11% share) in 2025, this concentration suggests a competitive environment for Infrastructure-as-a-Service (IaaS) and Platform-as-a-Service (PaaS) components. Benchmarking data for private B2B SaaS companies shows that the median spend on hosting is 5% of Annual Recurring Revenue (ARR). This relatively low, stable percentage suggests that while the providers are large, the commoditization of basic compute and storage limits their ability to extract outsized rents from Expensify, Inc., provided the company avoids vendor lock-in via complex, proprietary services.
Here's a quick look at the financial context surrounding these supplier relationships as of the latest reported quarter:
| Metric | Value (Q3 2025) | Context/Supplier Relevance |
|---|---|---|
| Revenue | $35.1 million | Base for calculating supplier cost percentages. |
| Expensify Card Interchange Revenue | $5.4 million | Direct revenue tied to card network/issuing bank relationship. |
| Paid Members | 642,000 | Scale of user base interacting with all suppliers. |
| FY 2025 Free Cash Flow Guidance | $19.0 million to $23.0 million | Overall financial health influencing negotiation leverage. |
| Median Hosting Spend (B2B SaaS Benchmark) | 5% of ARR | Indicates the typical cost pressure from cloud suppliers. |
The power dynamic is shifting internally due to proprietary tech. You can see this in the operational efficiency gains:
- Reduced customer support escalations by 80%.
- Cut SmartScan processing costs by 75%.
- Support for 45+ accounting integrations.
- Card interchange revenue growth of 18% year-over-year.
If onboarding takes 14+ days, churn risk rises, which is a decision point for the internal product team, not a supplier issue.
Finance: draft 13-week cash view by Friday.
Expensify, Inc. (EXFY) - Porter's Five Forces: Bargaining power of customers
You're looking at Expensify, Inc. (EXFY) in late 2025, and the customer side of the equation definitely warrants a close look. Honestly, the bargaining power of customers feels high, especially in the small to midsize business (SMB) segment where price sensitivity and feature parity are major concerns. When customers can easily walk away, they hold more sway over pricing and terms.
The recent subscriber numbers definitely signal this risk. For the third quarter of 2025, Expensify, Inc. reported that its paid members dropped to 642,000. That represents a 6% year-over-year decrease. While the company noted a flash number of 653,000 paid members for October 2025, suggesting a slight rebound from the Q3 average, that quarterly decline highlights tangible customer churn risk you need to watch.
The pricing structure itself contributes to this dynamic. Expensify, Inc. simplified its basic offering to the Collect plan at a flat $5 per member per month. This move, which brought the price back to 2010 levels for new sign-ups after April 1, 2025, intentionally lowers the barrier for customers to join or leave. There's no annual commitment required for this tier, which makes the decision to switch to a competitor much less painful financially. To be fair, this simplicity is great for SMBs, but it means Expensify, Inc. has to fight harder on features and service quality to retain them.
Here's a quick look at the key metrics driving this buyer power assessment:
| Metric | Value (as of Q3 2025) | Context |
|---|---|---|
| Average Paid Members | 642,000 | Q3 2025 average |
| YoY Paid Member Change | -6% | Decrease from Q3 2024 to Q3 2025 |
| Collect Plan Price | $5 per member/month | Flat rate, no annual commitment for new customers |
| Q3 2025 Revenue | $35.1 million | Revenue for the quarter |
| October 2025 Paid Members (Flash) | 653,000 | Uptick from Q3 average |
Customers certainly have strong, well-established alternatives, which keeps the pressure on Expensify, Inc. to justify its value proposition. For the enterprise space, you have entrenched players like SAP Concur, which has deep integration histories. For businesses looking for an integrated card and expense solution, competitors like Brex offer compelling, modern alternatives.
The existence of these options means customers can easily shop around based on specific needs. You see this pressure reflected in the need for Expensify, Inc. to push its higher-value products:
- Enterprise customers often look toward SAP Concur for deep system integration.
- SMBs seeking integrated corporate cards often evaluate Brex.
- The Collect plan at $5 targets the low-cost, simple-use segment.
- The Control plan starts at approximately $9 per active user/month for more complex needs.
If onboarding takes 14+ days, churn risk rises, especially when a competitor promises faster deployment.
Expensify, Inc. (EXFY) - Porter's Five Forces: Competitive rivalry
You're looking at a market where the big dogs, like SAP Concur, still hold significant ground, but the real heat is coming from well-funded fintechs such as Brex and Navan, all fighting for the same corporate spend dollar. This rivalry is defintely intense. Expensify, Inc. is smaller in scale compared to some of these established and aggressive players, which puts pressure on its pricing and feature development.
To give you a sense of scale, the consensus sales estimate for Expensify, Inc. for the full 2025 fiscal year stands at approximately $146.8 million. This places Expensify, Inc. in a position where it must compete aggressively on value and innovation against rivals with potentially deeper pockets or broader platform offerings.
Still, Expensify, Inc. is making strategic moves to diversify revenue away from pure subscription fees, focusing on transaction-based income. The interchange revenue generated from the Expensify Card is a key growth area. In Q3 2025, this revenue hit $5.4 million, marking a strong 18% year-over-year increase. This shows the card product is gaining traction, even as the core paid member base saw a dip.
Here's a quick look at some of the Q3 2025 financial context:
| Metric | Value | Context/Change |
|---|---|---|
| Q3 2025 Revenue | $35.1 million | 1% decrease year-over-year |
| Q3 2025 Interchange Revenue | $5.4 million | 18% increase year-over-year |
| Paid Members | 642,000 | 6% decrease year-over-year |
| Q3 2025 Net Loss | $2.3 million | Slightly higher than $2.2 million loss in prior year |
| FY 2025 Free Cash Flow Guidance | $19.0 million to $23.0 million | Reiterated guidance |
The core expense management software market is mature, honestly. That maturity forces Expensify, Inc. to pivot its strategy toward becoming a 'payments superapp' to unlock new avenues for growth. This pivot is evident in the focus on the card and travel products, which are showing better momentum than the core subscription metric.
The growth in ancillary services shows where the company is placing its bets to outmaneuver competitors:
- Interchange Revenue growth: 18% year-over-year in Q3 2025.
- Travel Bookings growth: 36% quarterly increase in Q3 2025.
- Travel Bookings growth since Q1 2025: 95% rise.
- Share repurchase in Q3 2025: Approximately $3.0 million.
The push to migrate users to the New Expensify platform, which is built around the Concierge AI, is a direct competitive action. If onboarding takes 14+ days, churn risk rises, especially when customers can easily switch to a competitor offering a smoother initial experience. Finance: draft 13-week cash view by Friday.
Expensify, Inc. (EXFY) - Porter's Five Forces: Threat of substitutes
The threat of substitutes for Expensify, Inc. remains a significant pressure point, especially as businesses evaluate the total cost of ownership and the breadth of functionality required. You see this pressure coming from multiple directions, from the simplest manual methods to highly integrated platforms.
High Threat from Manual Processes and Basic Software
For the smallest businesses, the threat of using manual processes, like spreadsheets, or relying on basic features within free or low-cost accounting software is persistent. Expensify, Inc.'s entry-level Collect plan is priced at $5 per member per month, which is designed to be an affordable alternative to these rudimentary methods. However, for a company with very simple expense needs, even this small recurring fee can be a hurdle when a free alternative exists, even if it requires more employee time. The fact that the company's paid members declined by 6% year-over-year to 642,000 in Q3 2025 suggests that some customers in this segment, or those with simple needs, may be churning to these lower-cost or free substitutes.
Integrated Platform Competition from Rivals
The most potent substitute threat comes from rivals like Rippling, which offer a unified platform combining expense management with core Human Capital Management (HCM) functions like HR and payroll. This integration allows for automated policy enforcement that directly leverages employee data-something a standalone expense tool struggles to match without heavy integration work. Rippling's spend management starts at $11 per user per month, but the value proposition is the consolidation, which one study suggested led to operational efficiency improvements of 42% and a 136% ROI over three years for users of their integrated system. This holistic approach substitutes the need for Expensify, Inc. by solving multiple operational problems at once.
Here's a quick comparison of the value proposition you are weighing:
| Feature/Metric | Expensify, Inc. (Standalone Focus) | Integrated Rival (e.g., Rippling) |
|---|---|---|
| Core Offering | Expense Management, Corporate Cards, Travel | Expense Management, HR, Payroll, IT |
| Q3 2025 Paid Members (EXFY) | 642,000 | Not Publicly Disclosed (Ecosystem Growth) |
| Interchange Revenue (Q3 2025) | $5.4 million (18% YoY growth) | Included in broader financial services revenue |
| Entry-Level Pricing (Per User/Month) | $5.00 (Collect Plan) | Starts at $11.00 (Bundled) |
| Policy Automation Leverage | Relies on expense data | Leverages real-time HR/Payroll data |
Internal Development by Large Enterprises
For very large enterprises, the threat is not an off-the-shelf product but building a proprietary solution. These organizations often have unique compliance, security, or legacy system integration requirements that off-the-shelf software, even Expensify, Inc.'s platform, cannot perfectly meet without extensive, costly customization. When a large firm decides to dedicate engineering resources to build a tool tailored exactly to their specific, complex workflows, that internal development acts as a perfect substitute, locking out external vendors like Expensify, Inc. from that revenue stream.
Competition in Corporate Travel Booking
The company's push into its new Expensify Travel product directly challenges established corporate travel booking substitutes, such as SAP Concur or specialized travel management companies. While Expensify Travel is showing strong momentum-with bookings increasing 36% quarterly in Q3 2025 and growing 95% since Q1 2025-the overall corporate travel market is massive, projected to reach $1.8 trillion globally by 2027. This scale means numerous entrenched players and new entrants are vying for share. The success of Expensify Travel, evidenced by securing a marquee customer like the Brooklyn Nets, is a necessary action to defend this revenue line, but the competitive field is deep.
- Expensify Travel bookings grew 36% quarter-over-quarter in Q3 2025.
- Adoption rate for Travel is noted as being twice that of the Expensify Card at its launch.
- The total B2B travel spending projection for 2027 is $1.8 trillion.
- The company generated $5.4 million in interchange revenue from the Expensify Card in Q3 2025.
Finance: draft 13-week cash view by Friday.
Expensify, Inc. (EXFY) - Porter's Five Forces: Threat of new entrants
You're looking at the barrier to entry for a new expense management player trying to take on Expensify, Inc. Honestly, the threat is moderate, not low. The basic expense reporting software is definitely replicable; that's the easy part. The real moat is the payments superapp model Expensify, Inc. is building, which demands serious capital and navigating a maze of financial regulations.
Consider the sheer plumbing required to make the system work seamlessly. A new entrant can't just launch an app; they need connections. Expensify, Inc. has already built out a massive network, supporting corporate card import from over 10,000+ banks worldwide. That level of integration is a huge upfront investment in time and technical resources that a startup would struggle to replicate quickly, especially when trying to match Expensify, Inc.'s global reach, which now includes support for EUR billing and beta access to the Expensify Card across the UK and EU.
Then there's the brand equity, which acts as a soft but significant barrier. Expensify, Inc. made a bold, high-profile move by serving as the title sponsor for the APX GP team in Apple Originals' F1® THE MOVIE, which premiered in June 2025. This wasn't cheap; the company paid a multi-million-dollar fee, part of over $40 million in total brand partnerships for the film. The payoff, however, is brand visibility that's hard to buy elsewhere. Management noted a 50%+ rise in brand awareness among core demographics and a 350% increase among ages 18-24 following the film's release.
The financial discipline Expensify, Inc. is demonstrating also sets a high bar for competitors. New entrants often burn cash for years trying to gain traction, but Expensify, Inc. is focused on positive cash generation. For the fiscal year 2025, the company reiterated its Free Cash Flow (FCF) guidance to be in the range of $19.0 million to $23.0 million. That target suggests an operational efficiency and scale that a new, unproven competitor would find incredibly difficult to match without burning significant venture capital just to stay afloat.
Here's a quick look at the key barriers built by Expensify, Inc.'s current scale and strategy:
- Integration Depth: Support for 10,000+ banks globally.
- Brand Momentum: Significant brand lift from the F1 movie sponsorship.
- Financial Discipline: Positive FCF guidance of $19.0 million to $23.0 million for FY 2025.
- Regulatory Footprint: Holding money transmission licenses in 48 states, with more to come.
To be fair, the core software is not proprietary, but the network effect and the integration layer are what create the friction for a new entrant. The complexity of compliance, especially with the company expanding its card services into the UK and EU, adds another layer of required expertise and capital outlay.
You can see how these factors combine to create a defensive position for Expensify, Inc. in the table below:
| Barrier Component | Metric/Data Point | Source of Barrier Strength |
|---|---|---|
| Integration Scale | Over 10,000+ banks supported for transaction import | Network effect; high cost/time for new entrants to build equivalent data feeds. |
| Brand Awareness | Reported 50%+ surge in brand awareness post-F1 movie | Soft barrier; high marketing spend required to achieve similar cultural penetration. |
| Financial Stability | FY 2025 FCF Guidance: $19.0 million to $23.0 million | Indicates operational maturity and ability to self-fund growth, unlike cash-burning rivals. |
| Product Maturity | New Expensify approaching 90% feature parity with Classic platform | Reduces immediate risk from users migrating due to feature gaps in the new platform. |
Finance: draft 13-week cash view by Friday.
Disclaimer
All information, articles, and product details provided on this website are for general informational and educational purposes only. We do not claim any ownership over, nor do we intend to infringe upon, any trademarks, copyrights, logos, brand names, or other intellectual property mentioned or depicted on this site. Such intellectual property remains the property of its respective owners, and any references here are made solely for identification or informational purposes, without implying any affiliation, endorsement, or partnership.
We make no representations or warranties, express or implied, regarding the accuracy, completeness, or suitability of any content or products presented. Nothing on this website should be construed as legal, tax, investment, financial, medical, or other professional advice. In addition, no part of this site—including articles or product references—constitutes a solicitation, recommendation, endorsement, advertisement, or offer to buy or sell any securities, franchises, or other financial instruments, particularly in jurisdictions where such activity would be unlawful.
All content is of a general nature and may not address the specific circumstances of any individual or entity. It is not a substitute for professional advice or services. Any actions you take based on the information provided here are strictly at your own risk. You accept full responsibility for any decisions or outcomes arising from your use of this website and agree to release us from any liability in connection with your use of, or reliance upon, the content or products found herein.