
|
Exclusive Networks SA (EXN.PA) DCF Valuation |
Fully Editable: Tailor To Your Needs In Excel Or Sheets
Professional Design: Trusted, Industry-Standard Templates
Investor-Approved Valuation Models
MAC/PC Compatible, Fully Unlocked
No Expertise Is Needed; Easy To Follow
Exclusive Networks SA (EXN.PA) Bundle
Engineered for accuracy, our Exclusive Networks SA (EXNPA) DCF Calculator empowers you to assess the valuation of Exclusive Networks SA (EXNPA) using real-world financial data, allowing you full flexibility to modify all key parameters for enhanced projections.
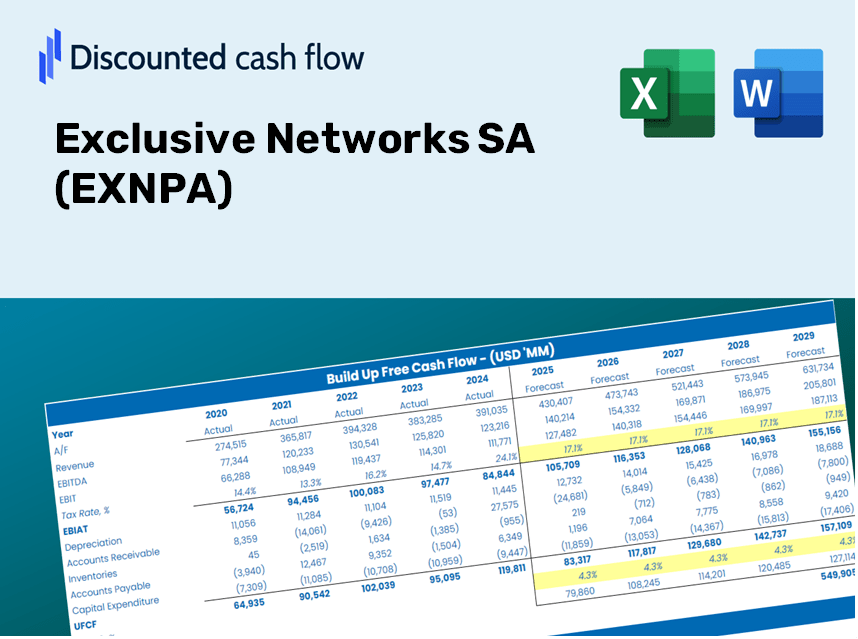
Discounted Cash Flow (DCF) - (USD MM)
| Year | AY1 2019 |
AY2 2020 |
AY3 2021 |
AY4 2022 |
AY5 2023 |
FY1 2024 |
FY2 2025 |
FY3 2026 |
FY4 2027 |
FY5 2028 |
|---|---|---|---|---|---|---|---|---|---|---|
| Revenue | 1,742.0 | 1,891.7 | 2,483.4 | 3,404.0 | 1,559.0 | 1,647.6 | 1,741.3 | 1,840.3 | 1,945.0 | 2,055.6 |
| Revenue Growth, % | 0 | 8.6 | 31.28 | 37.07 | -54.2 | 5.69 | 5.69 | 5.69 | 5.69 | 5.69 |
| EBITDA | 85.2 | 89.1 | 122.1 | 154.0 | 158.0 | 96.2 | 101.6 | 107.4 | 113.5 | 120.0 |
| EBITDA, % | 4.89 | 4.71 | 4.92 | 4.52 | 10.13 | 5.84 | 5.84 | 5.84 | 5.84 | 5.84 |
| Depreciation | 62.4 | 63.1 | 68.7 | 73.0 | 73.0 | 54.4 | 57.5 | 60.8 | 64.2 | 67.9 |
| Depreciation, % | 3.58 | 3.33 | 2.77 | 2.14 | 4.68 | 3.3 | 3.3 | 3.3 | 3.3 | 3.3 |
| EBIT | 22.9 | 26.1 | 53.4 | 81.0 | 85.0 | 41.8 | 44.1 | 46.6 | 49.3 | 52.1 |
| EBIT, % | 1.31 | 1.38 | 2.15 | 2.38 | 5.45 | 2.53 | 2.53 | 2.53 | 2.53 | 2.53 |
| Total Cash | 126.2 | 163.9 | 129.8 | 268.0 | 379.0 | 175.7 | 185.7 | 196.2 | 207.4 | 219.2 |
| Total Cash, percent | .0 | .0 | .0 | .0 | .0 | .0 | .0 | .0 | .0 | .0 |
| Account Receivables | 691.4 | 845.1 | 936.0 | 1,117.0 | 1,304.0 | 786.0 | 830.7 | 877.9 | 927.8 | 980.6 |
| Account Receivables, % | 39.69 | 44.67 | 37.69 | 32.81 | 83.64 | 47.7 | 47.7 | 47.7 | 47.7 | 47.7 |
| Inventories | 101.0 | 113.5 | 149.5 | 271.0 | 220.0 | 131.4 | 138.9 | 146.8 | 155.2 | 164.0 |
| Inventories, % | 5.8 | 6 | 6.02 | 7.96 | 14.11 | 7.98 | 7.98 | 7.98 | 7.98 | 7.98 |
| Accounts Payable | 558.8 | 677.6 | 790.0 | 1,098.0 | 1,362.0 | 722.7 | 763.8 | 807.3 | 853.2 | 901.7 |
| Accounts Payable, % | 32.08 | 35.82 | 31.81 | 32.26 | 87.36 | 43.87 | 43.87 | 43.87 | 43.87 | 43.87 |
| Capital Expenditure | -4.7 | -2.3 | -4.8 | -6.0 | -7.0 | -4.0 | -4.2 | -4.4 | -4.7 | -5.0 |
| Capital Expenditure, % | -0.26711 | -0.12179 | -0.19151 | -0.17626 | -0.44901 | -0.24114 | -0.24114 | -0.24114 | -0.24114 | -0.24114 |
| Tax Rate, % | 23.21 | 23.21 | 23.21 | 23.21 | 23.21 | 23.21 | 23.21 | 23.21 | 23.21 | 23.21 |
| EBITAT | 25.8 | -6.3 | -59.7 | 56.1 | 65.3 | 20.5 | 21.7 | 22.9 | 24.3 | 25.6 |
| Depreciation | ||||||||||
| Changes in Account Receivables | ||||||||||
| Changes in Inventories | ||||||||||
| Changes in Accounts Payable | ||||||||||
| Capital Expenditure | ||||||||||
| UFCF | -150.1 | 7.0 | -10.3 | 128.6 | 259.3 | 38.3 | 63.9 | 67.6 | 71.4 | 75.5 |
| WACC, % | 8.84 | 6.57 | 6.57 | 8.14 | 8.31 | 7.68 | 7.68 | 7.68 | 7.68 | 7.68 |
| PV UFCF | ||||||||||
| SUM PV UFCF | 250.1 | |||||||||
| Long Term Growth Rate, % | 2.00 | |||||||||
| Free cash flow (T + 1) | 77 | |||||||||
| Terminal Value | 1,354 | |||||||||
| Present Terminal Value | 935 | |||||||||
| Enterprise Value | 1,185 | |||||||||
| Net Debt | 182 | |||||||||
| Equity Value | 1,003 | |||||||||
| Diluted Shares Outstanding, MM | 91 | |||||||||
| Equity Value Per Share | 10.97 |
What You Will Receive
- Pre-Filled Financial Model: Exclusive Networks SA’s actual data allows for accurate DCF valuation.
- Comprehensive Forecast Control: Modify revenue growth rates, margins, WACC, and other essential drivers.
- Immediate Calculations: Automatic updates provide real-time results as you make adjustments.
- Investor-Ready Template: A polished Excel file crafted for sophisticated valuation needs.
- Customizable and Reusable: Designed for adaptability, enabling repeated use for in-depth forecasts.
Key Features
- Comprehensive Data: Exclusive Networks SA’s (EXNPA) historical financial statements along with pre-filled projections.
- Customizable Settings: Adjust WACC, tax rates, revenue growth, and EBITDA margins to fit your analysis.
- Real-Time Insights: Watch the intrinsic value of Exclusive Networks SA (EXNPA) update instantly.
- Intuitive Visualizations: Dashboard graphs illustrate valuation outcomes and essential metrics.
- Designed for Precision: A reliable tool tailored for analysts, investors, and finance professionals.
How It Functions
- Step 1: Download the preconfigured Excel template featuring Exclusive Networks SA’s data.
- Step 2: Navigate through the populated sheets to familiarize yourself with the essential metrics.
- Step 3: Modify the forecasts and assumptions in the editable yellow cells (WACC, growth, margins).
- Step 4: Instantly observe the recalibrated results, including Exclusive Networks SA’s intrinsic value.
- Step 5: Utilize the outputs to inform your investment choices or create reports.
Why Choose This Calculator for Exclusive Networks SA (EXNPA)?
- All-in-One Solution: Features DCF, WACC, and financial ratio analyses all in a single tool.
- Flexible Inputs: Modify the yellow-highlighted fields to explore different scenarios.
- In-Depth Analysis: Automatically determines the intrinsic value and Net Present Value of Exclusive Networks SA (EXNPA).
- Data Ready: Comes with historical and projected data for reliable starting points.
- High-Quality Standards: Perfect for financial analysts, investors, and business consultants.
Who Can Benefit from Our Product?
- Institutional Investors: Develop comprehensive and dependable valuation models for portfolio management.
- Corporate Finance Departments: Evaluate valuation scenarios to inform internal strategies.
- Consultants and Financial Advisors: Deliver precise valuation insights for Exclusive Networks SA (EXNPA) to your clients.
- Students and Instructors: Utilize real-world data to enhance learning and practice in financial modeling.
- Technology Enthusiasts: Gain insight into the market valuation of technology firms like Exclusive Networks SA (EXNPA).
Contents of the Template
- Pre-Filled DCF Model: Exclusive Networks SA’s (EXNPA) financial data ready for immediate analysis.
- WACC Calculator: Comprehensive calculations for the Weighted Average Cost of Capital.
- Financial Ratios: Assess Exclusive Networks SA’s profitability, leverage, and operational efficiency.
- Editable Inputs: Customize assumptions such as growth rates, profit margins, and capital expenditures to suit your analysis.
- Financial Statements: Access annual and quarterly reports for thorough evaluations.
- Interactive Dashboard: Effortlessly visualize key valuation metrics and outcomes.
Disclaimer
All information, articles, and product details provided on this website are for general informational and educational purposes only. We do not claim any ownership over, nor do we intend to infringe upon, any trademarks, copyrights, logos, brand names, or other intellectual property mentioned or depicted on this site. Such intellectual property remains the property of its respective owners, and any references here are made solely for identification or informational purposes, without implying any affiliation, endorsement, or partnership.
We make no representations or warranties, express or implied, regarding the accuracy, completeness, or suitability of any content or products presented. Nothing on this website should be construed as legal, tax, investment, financial, medical, or other professional advice. In addition, no part of this site—including articles or product references—constitutes a solicitation, recommendation, endorsement, advertisement, or offer to buy or sell any securities, franchises, or other financial instruments, particularly in jurisdictions where such activity would be unlawful.
All content is of a general nature and may not address the specific circumstances of any individual or entity. It is not a substitute for professional advice or services. Any actions you take based on the information provided here are strictly at your own risk. You accept full responsibility for any decisions or outcomes arising from your use of this website and agree to release us from any liability in connection with your use of, or reliance upon, the content or products found herein.