
|
First Advantage Corporation (FA) DCF Valuation |
Fully Editable: Tailor To Your Needs In Excel Or Sheets
Professional Design: Trusted, Industry-Standard Templates
Investor-Approved Valuation Models
MAC/PC Compatible, Fully Unlocked
No Expertise Is Needed; Easy To Follow
First Advantage Corporation (FA) Bundle
Explore the financial outlook of First Advantage Corporation (FA) with our user-friendly DCF Calculator! Enter your predictions for growth, margins, and expenses to determine the intrinsic value of First Advantage Corporation (FA) and refine your investment approach.
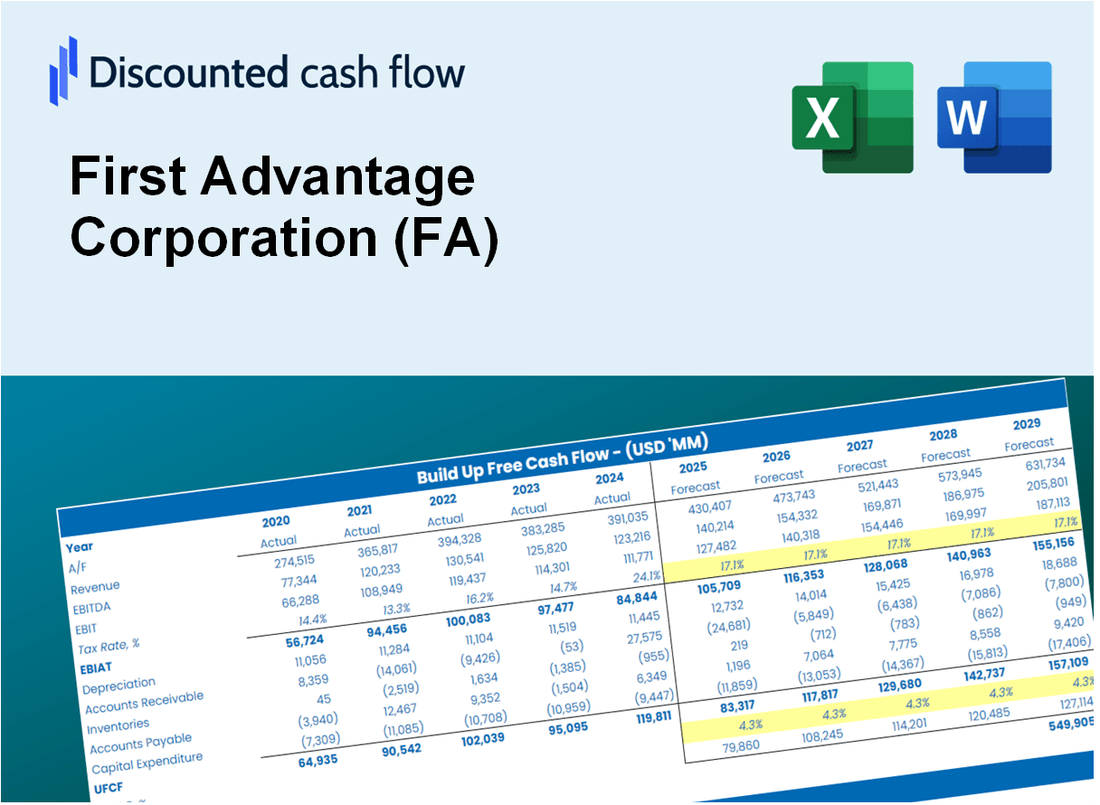
Discounted Cash Flow (DCF) - (USD MM)
| Year | AY1 2020 |
AY2 2021 |
AY3 2022 |
AY4 2023 |
AY5 2024 |
FY1 2025 |
FY2 2026 |
FY3 2027 |
FY4 2028 |
FY5 2029 |
|---|---|---|---|---|---|---|---|---|---|---|
| Revenue | 509.2 | 712.3 | 810.0 | 763.8 | 860.2 | 990.4 | 1,140.3 | 1,312.8 | 1,511.5 | 1,740.2 |
| Revenue Growth, % | 0 | 39.9 | 13.72 | -5.71 | 12.63 | 15.13 | 15.13 | 15.13 | 15.13 | 15.13 |
| EBITDA | 135.1 | 195.1 | 232.5 | 211.0 | 83.2 | 237.6 | 273.5 | 314.9 | 362.5 | 417.4 |
| EBITDA, % | 26.54 | 27.4 | 28.71 | 27.63 | 9.67 | 23.99 | 23.99 | 23.99 | 23.99 | 23.99 |
| Depreciation | 137.2 | 142.8 | 138.2 | 129.5 | 145.9 | 194.1 | 223.4 | 257.2 | 296.2 | 341.0 |
| Depreciation, % | 26.94 | 20.05 | 17.07 | 16.95 | 16.96 | 19.59 | 19.59 | 19.59 | 19.59 | 19.59 |
| EBIT | -2.0 | 52.3 | 94.3 | 81.5 | -62.8 | 43.5 | 50.1 | 57.7 | 66.4 | 76.4 |
| EBIT, % | -0.40243 | 7.35 | 11.64 | 10.67 | -7.3 | 4.39 | 4.39 | 4.39 | 4.39 | 4.39 |
| Total Cash | 154.2 | 293.6 | 393.6 | 213.8 | 168.7 | 332.2 | 382.4 | 440.3 | 507.0 | 583.7 |
| Total Cash, percent | .0 | .0 | .0 | .0 | .0 | .0 | .0 | .0 | .0 | .0 |
| Account Receivables | 117.0 | 158.1 | 147.0 | 146.4 | 275.5 | 226.8 | 261.2 | 300.7 | 346.2 | 398.6 |
| Account Receivables, % | 22.99 | 22.19 | 18.15 | 19.17 | 32.02 | 22.9 | 22.9 | 22.9 | 22.9 | 22.9 |
| Inventories | .0 | .0 | .0 | .0 | .0 | .0 | .0 | .0 | .0 | .0 |
| Inventories, % | 0 | 0 | 0 | 0 | 0 | 0 | 0 | 0 | 0 | 0 |
| Accounts Payable | 44.1 | 54.0 | 54.9 | 47.0 | 120.9 | 85.6 | 98.6 | 113.5 | 130.7 | 150.5 |
| Accounts Payable, % | 8.66 | 7.58 | 6.78 | 6.16 | 14.05 | 8.65 | 8.65 | 8.65 | 8.65 | 8.65 |
| Capital Expenditure | -17.7 | -23.8 | -28.5 | -27.7 | -1.7 | -28.1 | -32.3 | -37.2 | -42.8 | -49.3 |
| Capital Expenditure, % | -3.48 | -3.34 | -3.52 | -3.63 | -0.19995 | -2.83 | -2.83 | -2.83 | -2.83 | -2.83 |
| Tax Rate, % | 3.79 | 3.79 | 3.79 | 3.79 | 3.79 | 3.79 | 3.79 | 3.79 | 3.79 | 3.79 |
| EBITAT | -2.4 | 33.7 | 71.6 | 62.7 | -60.4 | 36.0 | 41.4 | 47.7 | 54.9 | 63.2 |
| Depreciation | ||||||||||
| Changes in Account Receivables | ||||||||||
| Changes in Inventories | ||||||||||
| Changes in Accounts Payable | ||||||||||
| Capital Expenditure | ||||||||||
| UFCF | 44.1 | 121.6 | 193.3 | 157.2 | 28.6 | 215.4 | 211.2 | 243.1 | 279.9 | 322.3 |
| WACC, % | 6.47 | 5.78 | 6 | 6.02 | 6.4 | 6.13 | 6.13 | 6.13 | 6.13 | 6.13 |
| PV UFCF | ||||||||||
| SUM PV UFCF | 1,053.6 | |||||||||
| Long Term Growth Rate, % | 4.00 | |||||||||
| Free cash flow (T + 1) | 335 | |||||||||
| Terminal Value | 15,708 | |||||||||
| Present Terminal Value | 11,664 | |||||||||
| Enterprise Value | 12,718 | |||||||||
| Net Debt | 1,988 | |||||||||
| Equity Value | 10,730 | |||||||||
| Diluted Shares Outstanding, MM | 149 | |||||||||
| Equity Value Per Share | 72.22 |
What You Will Get
- Real FA Financials: Includes historical and forecasted data for accurate valuation.
- Adjustable Inputs: Modify WACC, tax rates, revenue growth, and capital expenditures.
- Automatic Calculations: Intrinsic value and NPV are calculated dynamically.
- Scenario Analysis: Test multiple scenarios to evaluate First Advantage Corporation’s future performance.
- Clear and Intuitive Design: Built for professionals yet accessible for beginners.
Key Features
- Customizable Forecast Inputs: Adjust essential factors such as revenue projections, EBITDA margins, and capital investments.
- Instant DCF Valuation: Quickly computes intrinsic value, NPV, and additional financial metrics.
- High-Precision Accuracy: Leverages First Advantage Corporation’s (FA) actual financial data for dependable valuation results.
- Streamlined Scenario Analysis: Easily evaluate varying assumptions and analyze results without hassle.
- Efficiency Booster: Remove the complexity of constructing detailed valuation models from the ground up.
How It Works
- Download the Template: Gain immediate access to the Excel-based FA DCF Calculator.
- Input Your Assumptions: Modify the yellow-highlighted cells for growth rates, WACC, margins, and additional parameters.
- Instant Calculations: The model automatically calculates First Advantage Corporation’s intrinsic value.
- Test Scenarios: Experiment with various assumptions to assess potential changes in valuation.
- Analyze and Decide: Utilize the outcomes to inform your investment or financial analysis.
Why Choose This Calculator?
- Designed for Experts: A sophisticated tool utilized by analysts, CFOs, and consultants.
- Comprehensive Data: First Advantage Corporation’s (FA) historical and projected financials preloaded for precision.
- Scenario Analysis: Effortlessly simulate various forecasts and assumptions.
- Clear Results: Automatically computes intrinsic value, NPV, and essential metrics.
- User-Friendly: Step-by-step guidance helps you navigate the process with ease.
Who Should Use This Product?
- Investors: Evaluate First Advantage Corporation’s (FA) valuation prior to making investment decisions.
- CFOs and Financial Analysts: Enhance valuation methodologies and validate financial forecasts.
- Startup Founders: Understand the valuation strategies employed by established companies like First Advantage Corporation (FA).
- Consultants: Create comprehensive valuation reports for client engagements.
- Students and Educators: Utilize real-world data from First Advantage Corporation (FA) to learn and teach valuation practices.
What the Template Contains
- Operating and Balance Sheet Data: Pre-filled First Advantage Corporation (FA) historical data and forecasts, including revenue, EBITDA, EBIT, and capital expenditures.
- WACC Calculation: A dedicated sheet for Weighted Average Cost of Capital (WACC), featuring parameters such as Beta, risk-free rate, and share price.
- DCF Valuation (Unlevered and Levered): Editable Discounted Cash Flow models that display intrinsic value with comprehensive calculations.
- Financial Statements: Pre-loaded financial statements (annual and quarterly) to facilitate analysis.
- Key Ratios: Includes profitability, leverage, and efficiency ratios for First Advantage Corporation (FA).
- Dashboard and Charts: Visual summary of valuation outputs and assumptions for easy result analysis.
Disclaimer
All information, articles, and product details provided on this website are for general informational and educational purposes only. We do not claim any ownership over, nor do we intend to infringe upon, any trademarks, copyrights, logos, brand names, or other intellectual property mentioned or depicted on this site. Such intellectual property remains the property of its respective owners, and any references here are made solely for identification or informational purposes, without implying any affiliation, endorsement, or partnership.
We make no representations or warranties, express or implied, regarding the accuracy, completeness, or suitability of any content or products presented. Nothing on this website should be construed as legal, tax, investment, financial, medical, or other professional advice. In addition, no part of this site—including articles or product references—constitutes a solicitation, recommendation, endorsement, advertisement, or offer to buy or sell any securities, franchises, or other financial instruments, particularly in jurisdictions where such activity would be unlawful.
All content is of a general nature and may not address the specific circumstances of any individual or entity. It is not a substitute for professional advice or services. Any actions you take based on the information provided here are strictly at your own risk. You accept full responsibility for any decisions or outcomes arising from your use of this website and agree to release us from any liability in connection with your use of, or reliance upon, the content or products found herein.