
|
Fagron NV (FAGR.BR) DCF Valuation |
Fully Editable: Tailor To Your Needs In Excel Or Sheets
Professional Design: Trusted, Industry-Standard Templates
Investor-Approved Valuation Models
MAC/PC Compatible, Fully Unlocked
No Expertise Is Needed; Easy To Follow
Fagron NV (FAGR.BR) Bundle
Simplify Fagron NV valuation with this customizable DCF Calculator! Featuring real Fagron NV financials and adjustable forecast inputs, you can test scenarios and uncover Fagron NV fair value in minutes.
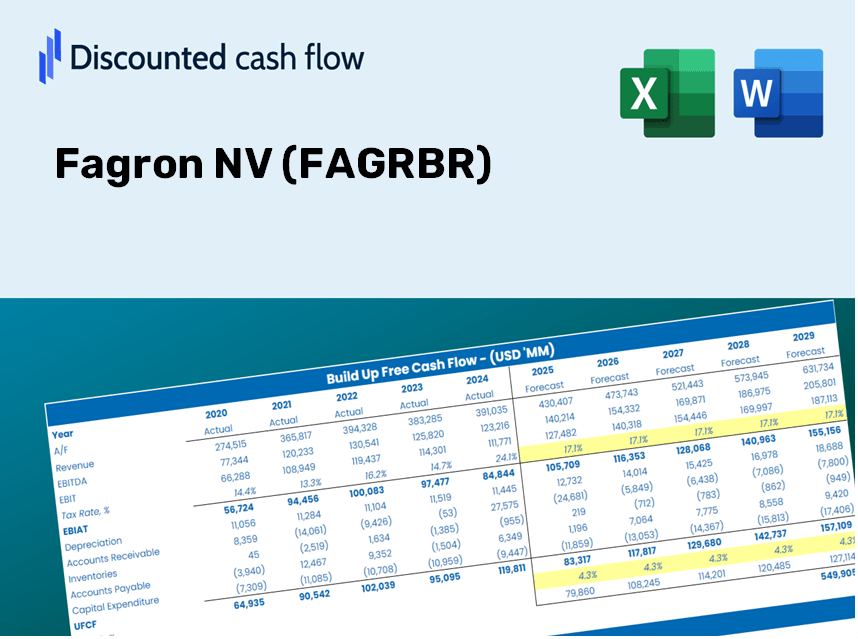
Discounted Cash Flow (DCF) - (USD MM)
| Year | AY1 2020 |
AY2 2021 |
AY3 2022 |
AY4 2023 |
AY5 2024 |
FY1 2025 |
FY2 2026 |
FY3 2027 |
FY4 2028 |
FY5 2029 |
|---|---|---|---|---|---|---|---|---|---|---|
| Revenue | 556.0 | 573.8 | 683.9 | 763.0 | 872.0 | 887.7 | 903.7 | 920.0 | 936.5 | 953.4 |
| Revenue Growth, % | 0 | 3.21 | 19.18 | 11.57 | 14.28 | 1.8 | 1.8 | 1.8 | 1.8 | 1.8 |
| EBITDA | 115.5 | 116.0 | 135.6 | 134.1 | 146.6 | 169.0 | 172.1 | 175.2 | 178.3 | 181.5 |
| EBITDA, % | 20.77 | 20.22 | 19.83 | 17.58 | 16.81 | 19.04 | 19.04 | 19.04 | 19.04 | 19.04 |
| Depreciation | 27.5 | 26.5 | 31.3 | 34.5 | 16.6 | 36.5 | 37.2 | 37.8 | 38.5 | 39.2 |
| Depreciation, % | 4.94 | 4.62 | 4.58 | 4.52 | 1.9 | 4.11 | 4.11 | 4.11 | 4.11 | 4.11 |
| EBIT | 88.0 | 89.5 | 104.3 | 99.6 | 130.0 | 132.5 | 134.9 | 137.3 | 139.8 | 142.3 |
| EBIT, % | 15.83 | 15.6 | 15.25 | 13.05 | 14.9 | 14.93 | 14.93 | 14.93 | 14.93 | 14.93 |
| Total Cash | 84.2 | 70.6 | 125.3 | 137.3 | 115.9 | 136.8 | 139.3 | 141.8 | 144.4 | 147.0 |
| Total Cash, percent | .0 | .0 | .0 | .0 | .0 | .0 | .0 | .0 | .0 | .0 |
| Account Receivables | 57.8 | 72.2 | 84.3 | 84.7 | 82.0 | 99.1 | 100.9 | 102.7 | 104.6 | 106.4 |
| Account Receivables, % | 10.4 | 12.59 | 12.33 | 11.1 | 9.4 | 11.16 | 11.16 | 11.16 | 11.16 | 11.16 |
| Inventories | 79.8 | 90.8 | 108.3 | 113.9 | 137.0 | 136.1 | 138.6 | 141.1 | 143.6 | 146.2 |
| Inventories, % | 14.35 | 15.83 | 15.84 | 14.93 | 15.71 | 15.33 | 15.33 | 15.33 | 15.33 | 15.33 |
| Accounts Payable | 72.3 | 83.7 | 97.9 | 104.9 | 107.5 | 120.7 | 122.8 | 125.1 | 127.3 | 129.6 |
| Accounts Payable, % | 13 | 14.58 | 14.31 | 13.75 | 12.33 | 13.59 | 13.59 | 13.59 | 13.59 | 13.59 |
| Capital Expenditure | -18.4 | -20.7 | -18.5 | -38.5 | -26.2 | -31.4 | -32.0 | -32.5 | -33.1 | -33.7 |
| Capital Expenditure, % | -3.31 | -3.61 | -2.7 | -5.04 | -3.01 | -3.54 | -3.54 | -3.54 | -3.54 | -3.54 |
| Tax Rate, % | 22.76 | 22.76 | 22.76 | 22.76 | 22.76 | 22.76 | 22.76 | 22.76 | 22.76 | 22.76 |
| EBITAT | 71.2 | 71.1 | 82.7 | 83.2 | 100.4 | 106.1 | 108.0 | 110.0 | 112.0 | 114.0 |
| Depreciation | ||||||||||
| Changes in Account Receivables | ||||||||||
| Changes in Inventories | ||||||||||
| Changes in Accounts Payable | ||||||||||
| Capital Expenditure | ||||||||||
| UFCF | 14.8 | 62.8 | 80.1 | 80.4 | 73.0 | 108.1 | 111.2 | 113.2 | 115.2 | 117.3 |
| WACC, % | 4.74 | 4.72 | 4.72 | 4.76 | 4.7 | 4.73 | 4.73 | 4.73 | 4.73 | 4.73 |
| PV UFCF | ||||||||||
| SUM PV UFCF | 491.9 | |||||||||
| Long Term Growth Rate, % | 3.00 | |||||||||
| Free cash flow (T + 1) | 121 | |||||||||
| Terminal Value | 6,985 | |||||||||
| Present Terminal Value | 5,544 | |||||||||
| Enterprise Value | 6,036 | |||||||||
| Net Debt | 272 | |||||||||
| Equity Value | 5,764 | |||||||||
| Diluted Shares Outstanding, MM | 73 | |||||||||
| Equity Value Per Share | 79.03 |
What You Will Receive
- Flexible Forecast Variables: Modify key assumptions (growth %, margins, WACC) effortlessly to generate various scenarios.
- Comprehensive Data: Fagron NV’s financial information pre-loaded for seamless analysis.
- Instant DCF Calculations: The template automatically computes Net Present Value (NPV) and intrinsic value.
- Tailored and Professional Design: A refined Excel model that caters to your valuation requirements.
- Designed for Analysts and Investors: Perfect for evaluating projections, confirming strategies, and optimizing efficiency.
Core Features
- Authentic Fagron Financials: Gain access to precise, pre-loaded historical data and future forecasts.
- Adjustable Forecast Parameters: Modify the yellow-highlighted fields such as WACC, growth rates, and profit margins.
- Real-Time Calculations: Instant updates to DCF, Net Present Value (NPV), and cash flow assessments.
- Interactive Dashboard: User-friendly charts and summaries to help you visualize your valuation findings.
- Suitable for All Levels: An easy-to-navigate layout designed for investors, CFOs, and consultants alike.
How It Functions
- Step 1: Download the prebuilt Excel template featuring Fagron NV’s data.
- Step 2: Navigate through the pre-filled sheets to grasp the essential metrics.
- Step 3: Adjust forecasts and assumptions in the editable yellow cells (WACC, growth, margins).
- Step 4: Instantly view updated results, including Fagron NV’s intrinsic value.
- Step 5: Make well-informed investment decisions or create reports based on the outputs.
Reasons to Choose This Calculator for Fagron NV (FAGRBR)
- Precision: Utilizes actual Fagron NV financial data for reliable results.
- Versatility: Built to allow users to easily adjust and test various inputs.
- Efficiency: Eliminate the need to create a DCF model from the ground up.
- Expert-Level: Crafted with the accuracy and functionality expected by CFOs.
- Intuitive: Simple to navigate, suitable for users without extensive financial modeling knowledge.
Who Should Consider This Product?
- Investors: Make informed investment choices by accurately assessing Fagron NV’s fair value.
- CFOs: Utilize a high-quality DCF model for precise financial reporting and analysis.
- Consultants: Effortlessly customize the template for client valuation reports.
- Entrepreneurs: Discover financial modeling strategies employed by leading companies.
- Educators: Employ it as a resource to teach various valuation techniques.
Contents of the Template
- Pre-Filled Data: Features Fagron NV's historical financial performance and projections.
- Discounted Cash Flow Model: An editable DCF valuation model with automatic computation features.
- Weighted Average Cost of Capital (WACC): A dedicated section for calculating WACC using tailored inputs.
- Key Financial Ratios: Evaluate Fagron NV's profitability, efficiency, and capital structure.
- Customizable Inputs: Easily modify revenue growth, profit margins, and tax rates.
- Clear Dashboard: Visualizations and tables highlighting essential valuation outcomes.
Disclaimer
All information, articles, and product details provided on this website are for general informational and educational purposes only. We do not claim any ownership over, nor do we intend to infringe upon, any trademarks, copyrights, logos, brand names, or other intellectual property mentioned or depicted on this site. Such intellectual property remains the property of its respective owners, and any references here are made solely for identification or informational purposes, without implying any affiliation, endorsement, or partnership.
We make no representations or warranties, express or implied, regarding the accuracy, completeness, or suitability of any content or products presented. Nothing on this website should be construed as legal, tax, investment, financial, medical, or other professional advice. In addition, no part of this site—including articles or product references—constitutes a solicitation, recommendation, endorsement, advertisement, or offer to buy or sell any securities, franchises, or other financial instruments, particularly in jurisdictions where such activity would be unlawful.
All content is of a general nature and may not address the specific circumstances of any individual or entity. It is not a substitute for professional advice or services. Any actions you take based on the information provided here are strictly at your own risk. You accept full responsibility for any decisions or outcomes arising from your use of this website and agree to release us from any liability in connection with your use of, or reliance upon, the content or products found herein.