
|
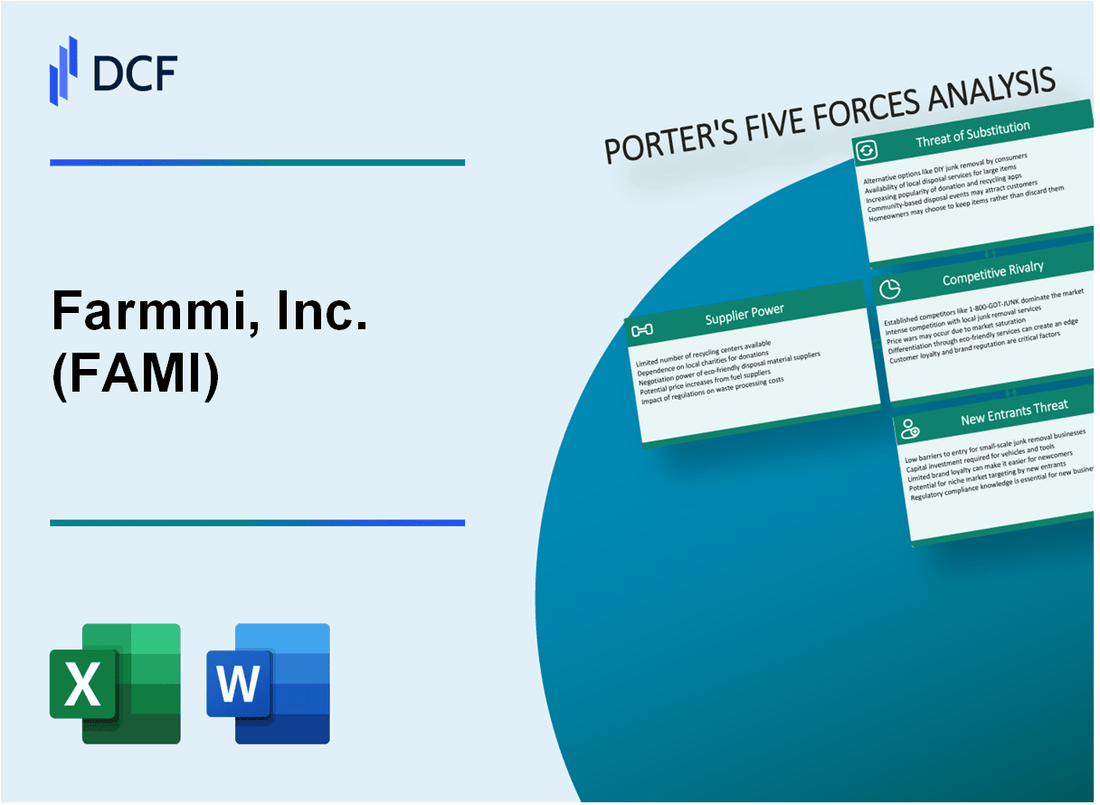
Farmmi, Inc. (FAMI): 5 FORCES Analysis [Nov-2025 Updated] |
Fully Editable: Tailor To Your Needs In Excel Or Sheets
Professional Design: Trusted, Industry-Standard Templates
Investor-Approved Valuation Models
MAC/PC Compatible, Fully Unlocked
No Expertise Is Needed; Easy To Follow
Farmmi, Inc. (FAMI) Bundle
You're looking for a clear read on Farmmi, Inc.'s battlefield position as of late 2025, and honestly, the numbers from the last fiscal year-like that -41.89% revenue drop and a $5.3 million net loss as of March 31, 2025-suggest a tough fight. Before you commit any capital or strategy, we need to map out the external pressures using Porter's Five Forces, because understanding who holds the power-suppliers, customers, or new rivals-is everything when your market cap is only around $7.62 million. Dive into the breakdown below to see exactly where Farmmi, Inc. is exposed and where it might have a hidden edge in this fragmented industry.
Farmmi, Inc. (FAMI) - Porter's Five Forces: Bargaining power of suppliers
You're looking at Farmmi, Inc.'s supplier landscape, and honestly, it's a mixed bag. The power suppliers hold over Farmmi, Inc. isn't uniform; it really depends on what raw material we're talking about. For their core edible mushroom business, Farmmi, Inc. has taken concrete steps to keep suppliers in check.
Power is mitigated by Farmmi's network of standardized family farms. By investing in and managing this network, Farmmi, Inc. gains better control right at the source of its primary raw material. This structure means they aren't just passively accepting whatever the open market offers; they are actively shaping the supply base for quality and consistency. This direct involvement definitely helps dampen supplier leverage.
Still, when you look at the newer segments, the dynamic shifts. Sourcing of commodity products like corn and cotton increases supplier power volatility. These are massive, global markets, and as we saw with continuing global drought conditions affecting inventory security for many customers, price swings and supply reliability for these commodities are much harder for Farmmi, Inc. to dictate compared to their specialized fungi.
Here's a quick look at some key 2025 financial figures that show the company's current financial footing, which impacts how much pricing pressure they can absorb from suppliers:
| Financial Metric (FY 2025 Est.) | Amount/Value | Unit |
|---|---|---|
| Market Capitalization | $10.69 M | USD |
| Debt To Equity Ratio | 0.02 | Ratio |
| Current Ratio | 49.62 X | Ratio |
| Cash Flow From Operations | (16.78 M) | USD |
| Working Capital | 151.87 M | USD |
Vertical integration in processing gives Farmmi more control over raw fungi supply. This isn't just talk; Farmmi, Inc.'s processing facility has established a comprehensive quality control management system. They hold gold standard certifications, including HACCP international food safety and health system, BRC international food, and QS China's food safety system. These certifications require strict supplier adherence, effectively locking in quality standards and reducing the pool of acceptable suppliers, which is a form of control.
Supplier switching costs are moderate due to specialized fungi processing needs. While a corn supplier might be swapped out with less friction, the specific nature of fungi processing-which demands particular input characteristics-means moving to a new supplier isn't instantaneous. Furthermore, Farmmi, Inc.'s investment in infrastructure, like the 636,000 square foot warehouse and logistics base established in Los Angeles in 2024, suggests deep integration into specific distribution and handling protocols that might make switching upstream suppliers more complex than it first appears. It's a defintely nuanced situation.
- Network of standardized family farms mitigates fungi source power.
- Corn and cotton sourcing introduces commodity price volatility.
- Processing certifications (HACCP, BRC) enforce supplier quality control.
- Logistics base expansion implies moderate, infrastructure-related switching costs.
Farmmi, Inc. (FAMI) - Porter's Five Forces: Bargaining power of customers
You're looking at Farmmi, Inc. (FAMI) through the lens of buyer power, and the picture is definitely one of significant leverage held by its customers, especially in certain segments. For the core agricultural products business, Farmmi sells through local distributors to processing manufacturers, supermarkets, restaurants, cafeterias, and local specialty stores. When you are dealing with large supermarket chains or major distributors buying in bulk, their ability to negotiate prices is high, which directly pressures Farmmi's margins. Honestly, this is standard for the packaged food sector.
The introduction of the direct-to-consumer e-commerce channel, Farmmi Jicai, is a strategic move intended to slightly dilute the leverage held by these large, traditional distributors. However, without specific revenue breakdowns for Farmmi Jicai as of late 2025, it's hard to quantify exactly how much this channel is offsetting the power of bulk buyers.
The logistics segment, however, shows a very clear example of concentrated customer power. Farmmi USA secured a strategic cooperation agreement with Mazon Technology LLC that could potentially generate $10 million in annual orders for warehousing and logistics services. To put that in perspective, Farmmi's revenue for the twelve months ending March 31, 2025, was reported at $43.83 million. This single potential customer contract represents a substantial portion of the company's recent top line, meaning the loss of this one deal would be a major financial event.
Here's a quick look at how that potential logistics revenue stacks up against recent financial scale:
| Metric | Amount (as of late 2025 data) |
| Potential Annual Logistics Orders (Mazon Deal) | $10 million |
| Revenue (Trailing Twelve Months ending Mar 31, 2025) | $43.83 million |
| Annual Revenue (Fiscal Year ending Sep 30, 2024) | $64.13 million |
| Market Capitalization (Approx. Nov 2025) | $8.50 million |
The general customer base for Farmmi's core agricultural products faces low switching costs. If a supermarket chain needs dried Shiitake mushrooms, switching to a competitor that offers similar quality and price is relatively easy; there isn't much proprietary lock-in. This lack of differentiation in the commodity aspect of their offerings keeps buyer power elevated.
You should keep an eye on these factors:
- Large distributors and supermarket chains exert significant pricing pressure.
- The logistics segment is highly exposed to a few large contracts.
- Switching costs for general food products remain low for buyers.
- The e-commerce channel is a mitigating factor, but its impact is unquantified.
Farmmi, Inc. (FAMI) - Porter's Five Forces: Competitive rivalry
You're looking at Farmmi, Inc. in a market that is notoriously tough, which is the global food products and packaged foods industry. Honestly, the competitive rivalry here is intense, and for a smaller player like Farmmi, Inc., that pressure is amplified. This industry is characterized by a massive scale of established players and a constant influx of niche competitors, all fighting for shelf space and consumer dollars. The backdrop of geo-economic fragmentation in global commodities only adds layers of uncertainty to sourcing and pricing for everyone involved in agricultural products.
The financial data clearly reflects the strain this rivalry puts on Farmmi, Inc.'s operations. For instance, the company's reported Fiscal Year 2024 revenue fell by a steep -41.89%. That kind of drop signals significant market share erosion or severe pricing pressure from rivals who are perhaps better capitalized or have stronger distribution networks. When revenue shrinks that fast, you know the competition is biting hard.
The competitive set is broad, which is typical in this sector. Farmmi, Inc. is battling not just the giants, but also numerous small-cap peers who are hungry for growth. We see this when we look at companies like Sow Good (SOWG), which is focused on freeze-dried snacks, and Top Wealth Group (TWG); both are listed in the same general food products industry space, creating direct and indirect competition for capital and consumer attention.
This market uncertainty and the pressure to compete are certainly reflected in Farmmi, Inc.'s stock performance metrics. The stock volatility, evidenced by a Beta of 1.84, suggests that Farmmi, Inc.'s share price reacts much more dramatically to overall market movements than the average stock, which is a classic sign of elevated competitive risk in a small-cap name. Also, when you look at profitability, the situation fuels a race to the bottom on price. The Trailing Twelve Months (TTM) Net Income, as of March 31, 2025, stood at a loss of -$5.3 million. That negative bottom line definitely pushes management toward aggressive pricing strategies to try and generate sales volume, which just intensifies the rivalry further.
Here's a quick look at some of the financial indicators that underscore the competitive environment's impact on Farmmi, Inc. as of early 2025:
| Metric | Value (as of early 2025) |
|---|---|
| TTM Revenue | $43.83 million |
| TTM Net Income (Mar 31, 2025) | -$5.3 million |
| EPS (TTM) | -$6.18 |
| Stock Beta | 1.84 |
The low TTM Gross Profit of $2.54 million, when set against the TTM Revenue of $43.83 million, shows razor-thin margins before operating expenses even factor in. That tight margin structure means there is very little room for error or for absorbing competitive shocks without bleeding cash, which is exactly what the negative Net Income shows. You need to watch how Farmmi, Inc. manages its cost of goods sold against competitors who might have better economies of scale.
The competitive rivalry is characterized by several key pressures:
- Intense rivalry in the fragmented global food products and packaged foods industry.
- Farmmi's FY2024 revenue fell -41.89%, indicating significant market share pressure.
- Competitors are numerous, including small-cap peers like Sow Good (SOWG) and Top Wealth Group (TWG).
- High stock volatility, with a Beta of 1.84, reflects market uncertainty and competitive risk.
- Low TTM Net Income of -$5.3 million (as of March 31, 2025) fuels price-based competition.
Also, consider the market's perception of risk. The market capitalization as of late November 2025 was reported at just $1.83 million, which is tiny in this sector, making Farmmi, Inc. highly susceptible to competitive moves from larger, better-funded entities. Finance: draft 13-week cash view by Friday.
Farmmi, Inc. (FAMI) - Porter's Five Forces: Threat of substitutes
You're analyzing Farmmi, Inc. (FAMI) and the external pressures on its specialty food business, specifically how easily customers can switch to alternatives for their edible fungi products. The threat of substitutes here is quite pronounced because the market is broad and driven by both health trends and price sensitivity.
The high threat comes from readily available alternative protein and vegetable sources. The global alternative protein market is estimated to be worth USD 21.5 billion in 2025, with plant-based proteins commanding a 62% share of that segment. While Farmmi, Inc. focuses on specialty fungi like Shiitake and Mu Er, these compete against the entire universe of plant-based options, which are scaling up rapidly. To put this in perspective, the total global protein market, including animal and dairy, is valued at USD 430 billion in 2025, meaning alternative proteins are still only about a 5% share, but that share is growing fast.
Fungi products face substitution from cheaper, non-specialty agricultural commodities. This is a dual threat for Farmmi, Inc. because they are also involved in trading cotton and corn. For the core fungi business, cheaper vegetables are always an option. For the commodity side, the substitution risk is clear from estimated 2025 returns in Mississippi; for example, irrigated cotton production shows an estimated return of -$7.50 per acre in the Delta area, while non-irrigated corn shows $64.94 per acre. These commodity price swings demonstrate the volatility and low-margin environment that specialty fungi must avoid by staying specialized, but the very existence of these large, volatile markets represents an alternative use of capital and supply chain focus.
Private label brands in major retail channels serve as a direct substitute for branded products. This is a significant headwind, as private label market penetration in the US is nearing 25% in 2025, up from 19% in 2023. Retailers are actively increasing investment, aiming for 25.6% private brand dollar share by 2027. Furthermore, consumer perception is shifting; 44% of consumers now believe store brands offer good value, and 35% think they are equal to or higher quality than name brands. The US Private Label Food Market itself is projected to reach USD 283.36 billion by 2030.
Diversification into corn and cotton increases exposure to commodity substitution risks, which can pull management focus away from the higher-margin fungi business. Farmmi, Inc. explicitly noted leveraging its platform for 'significant new greenfield revenue opportunities we recently added in corn and cotton'. While this diversifies revenue streams, it forces Farmmi, Inc. to compete against established, massive commodity markets where price is the primary driver, contrasting with the value proposition of specialty edible fungi.
Here's a quick look at the competitive landscape for substitutes in the protein space:
| Protein Category | Estimated Market Size/Share (2025) | Key Competitive Factor | Relevance to Farmmi, Inc. (FAMI) |
| Global Alternative Protein Market | USD 21.5 billion (Total Market Size) | Sustainability and Health Trends | Directly competes for the 'healthy alternative' dollar. |
| Plant-Based Proteins (Segment Share) | 62% of Alternative Protein Market | Scale and Consumer Familiarity (Soy, Pea) | Represents the established, scaled substitute. |
| Private Label Food (US Market Value) | Projected USD 145.63 billion (2024 base) | Value Perception (44% see good value) | Substitutes Farmmi's branded fungi offerings on retail shelves. |
| Farmmi, Inc. Core Fungi Business | Gross Profit Margin: 5.79% (TTM) | Specialty/Nutritional Value | The branded product Farmmi must defend against substitutes. |
Also, consider the pressure from other emerging protein substitutes:
- Novel sources like mycoprotein and seaweed-based proteins are gaining traction.
- Recombinant protein technology is creating realistic dairy and egg substitutes.
- Mushroom extracts are blending with pea and soy for improved bioavailability.
If onboarding takes 14+ days, churn risk rises, and in this environment, a customer choosing a readily available private label mushroom product over a Farmmi, Inc. branded one is a real possibility. Finance: draft 13-week cash view by Friday.
Farmmi, Inc. (FAMI) - Porter's Five Forces: Threat of new entrants
You're assessing the competitive landscape for Farmmi, Inc. (FAMI) and the threat of new entrants is a key factor, especially given the company's current market position. Honestly, for certain segments of Farmmi's business, the door isn't exactly bolted shut.
The threat of new entrants is relatively low for the high-end, vertically integrated, and certified segments of Farmmi's business, but it's higher for basic trading operations. For small-scale agricultural product trading and basic e-commerce sales, capital barriers are low. You can start trading commodities using digital platforms with initial capital estimates for a lean startup model sometimes starting as low as $75,000, covering platform development and initial working capital. This suggests that smaller, agile competitors can enter the less complex aspects of the market relatively easily.
However, Farmmi, Inc. has built up specific structural advantages that raise the bar for serious competitors. These barriers are moderate and relate to quality assurance and integration:
- Vertical integration provides better control over food safety at the source through standardized family farms.
- International certifications act as a quality moat; a Farmmi subsidiary successfully passed stringent HACCP and BRC Global Standard for Food Safety audits back in September 2020, and the processing facility holds gold standard certifications from HACCP.
Here's a quick look at how these factors compare:
| Entry Barrier Component | Farmmi, Inc. Status/Data Point | Implication for New Entrants |
| Initial Trading Capital | Can start with as low as $75,000 for a lean e-commerce model | High Threat for basic trading |
| Quality/Safety Certification | Holds HACCP and BRC certifications | Moderate Threat; requires time and investment to replicate |
| Logistics Infrastructure (US) | Total US warehousing footprint of 640,000 square feet as of August 2025 | Moderate to High Threat due to scale |
The incumbent's size in the public markets also plays a role in perceived threat. Farmmi's small market capitalization of approximately $7.62 million makes it a less imposing incumbent. For context, market capitalization data in November 2025 showed figures ranging from $1.98M to $8.49 Million USD depending on the reporting source. This relatively small valuation suggests that Farmmi, Inc. does not possess the deep financial war chest of a large-cap firm to aggressively deter new entrants through price wars or massive capital expenditure alone.
Still, new entrants in the US logistics business face high capital costs for new warehouse infrastructure, which is a significant barrier. Farmmi, Inc. recently expanded its footprint by leasing a new 183,000 square foot facility in Robbinsville, New Jersey, in August 2025. To put that cost into perspective, the national average warehouse rental rate in early 2025 was approximately $9.00 per square foot annually, with high-demand areas like Northern New Jersey commanding $16-$20/SF. Building a large, high-end distribution warehouse in 2025 could cost between $50 to $120 per square foot in construction. A new entrant aiming to match Farmmi's total 640,000 square feet footprint would face multi-million dollar capital commitments just for real estate, which is a substantial hurdle compared to starting a simple trading operation.
Finance: draft 13-week cash view by Friday.
Disclaimer
All information, articles, and product details provided on this website are for general informational and educational purposes only. We do not claim any ownership over, nor do we intend to infringe upon, any trademarks, copyrights, logos, brand names, or other intellectual property mentioned or depicted on this site. Such intellectual property remains the property of its respective owners, and any references here are made solely for identification or informational purposes, without implying any affiliation, endorsement, or partnership.
We make no representations or warranties, express or implied, regarding the accuracy, completeness, or suitability of any content or products presented. Nothing on this website should be construed as legal, tax, investment, financial, medical, or other professional advice. In addition, no part of this site—including articles or product references—constitutes a solicitation, recommendation, endorsement, advertisement, or offer to buy or sell any securities, franchises, or other financial instruments, particularly in jurisdictions where such activity would be unlawful.
All content is of a general nature and may not address the specific circumstances of any individual or entity. It is not a substitute for professional advice or services. Any actions you take based on the information provided here are strictly at your own risk. You accept full responsibility for any decisions or outcomes arising from your use of this website and agree to release us from any liability in connection with your use of, or reliance upon, the content or products found herein.