
|
Diamondback Energy, Inc. (FANG): 5 FORCES Analysis [Nov-2025 Updated] |
Fully Editable: Tailor To Your Needs In Excel Or Sheets
Professional Design: Trusted, Industry-Standard Templates
Investor-Approved Valuation Models
MAC/PC Compatible, Fully Unlocked
No Expertise Is Needed; Easy To Follow
Diamondback Energy, Inc. (FANG) Bundle
You're assessing the competitive moat around Diamondback Energy, Inc. as of late 2025, and honestly, while the Permian Basin remains a tough neighborhood-with Q1 realized oil prices hitting $\mathbf{\$70.95/bbl}$-the firm has carved out significant structural advantages. My analysis shows that despite intense rivalry focused on cost-per-barrel, Diamondback Energy's operational efficiency is winning, delivering $\mathbf{15\%}$ more free cash flow per share this year, even as they scale production toward $\mathbf{910-920}$ MBOE/d. Crucially, the massive capital barrier, evidenced by their $\mathbf{\$3.4-\$3.6}$ billion capex budget, keeps new entrants at bay, and they are successfully pushing back against suppliers, all while positioning for the long-term energy transition by securing gas deals like that $\mathbf{50}$ million cubic feet per day contract. Keep reading to see exactly how these five forces shape their near-term strategy.
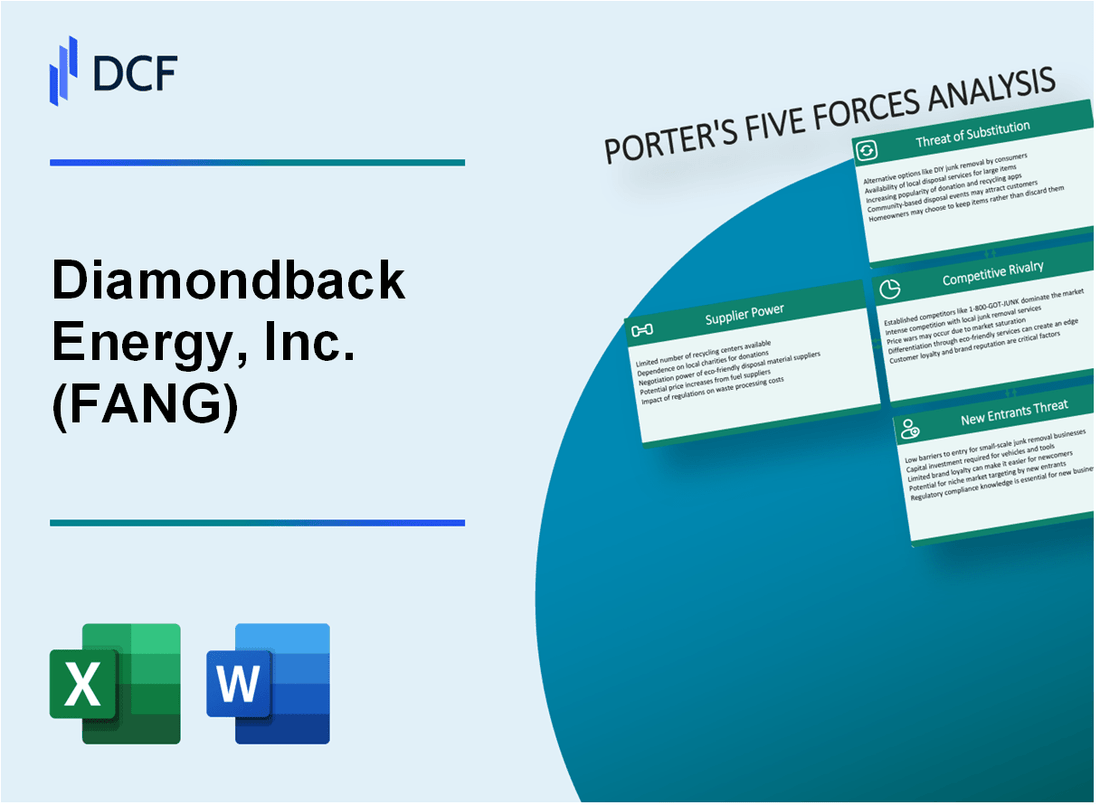
Diamondback Energy, Inc. (FANG) - Porter's Five Forces: Bargaining power of suppliers
You're looking at the supplier side of Diamondback Energy, Inc.'s business as of late 2025, and honestly, the leverage pendulum has swung back in your favor. The environment for oilfield service (OFS) providers has tightened considerably compared to the peak activity years.
Power is definitely shifting back to Diamondback Energy due to lower oil prices and tighter Exploration & Production (E&P) budgets across the board this year. For instance, the average WTI oil price for the first nine months of 2025 was $66.65 per barrel, which is a 14% drop from the $77.61 average seen in the same period of 2024. This pricing pressure forces large purchasers like Diamondback Energy to be extremely disciplined with their spending, which directly translates to less revenue and less pricing power for their suppliers.
Oilfield service (OFS) pricing is clearly under pressure because rig and frac spread counts have been declining in the Permian Basin. You can see this in the activity metrics; for example, the Permian Basin rig count fell to 255 rigs for the week ending August 15, 2025, down 1 from the week prior. Furthermore, the number of active frac crews in the Permian was down to 91 as of early June 2025, compared to 102 crews the prior year. Even back in early April 2025, the Permian Basin rig total had already hit 294, its lowest level since February 2022. Fewer active rigs and fewer frac spreads mean less utilization for service companies, which naturally weakens their negotiating position.
Consolidation among Permian operators, including Diamondback Energy's own roll-up strategy with the recent Endeavor Energy Resources and Double Eagle acquisitions, increases customer concentration. When fewer, larger customers dominate the market, they gain significant leverage over service firms. Diamondback Energy is actively streamlining its asset base, even announcing plans to sell non-Permian assets for $670 million as part of a larger $1.5 billion disposal target. This focus on scale and efficiency means Diamondback Energy can demand better terms from suppliers who rely on their continued activity.
This dynamic is cemented by Diamondback Energy's own capital discipline, which directly limits supplier revenue. The company slashed its 2025 cash capital expenditures by $500 million from its original guidance, representing about a 13% reduction. The updated full-year 2025 CapEx guidance is now set between $3.4 billion and $3.6 billion, down from the original midpoint near $4.0 billion. When Diamondback Energy reduces its planned spending, it directly reduces the total addressable market for its suppliers.
Here's a quick look at how Diamondback Energy's capital restraint impacts the operational landscape that suppliers face:
| Metric | Value / Context | Timeframe | Source of Pressure |
|---|---|---|---|
| Full Year 2025 Cash CAPEX Reduction | $500 million (from original guidance) | 2025 Guidance Update | Tighter E&P Budgets |
| Updated Full Year 2025 Cash CAPEX Range | $3.4 billion - $3.6 billion | 2025 Guidance Update | Tighter E&P Budgets |
| Permian Basin Active Rigs | 255 rigs (down 1 week-over-week) | Week ending August 15, 2025 | Declining Activity |
| Permian Active Frac Spreads | 91 crews (down from 102 YoY) | Week ended June 6, 2025 | Declining Activity |
| Average WTI Oil Price | $66.65/bbl (down 14% YoY) | First Nine Months of 2025 | Lower Oil Prices |
It's important to note that supplier power isn't entirely absent; for instance, in Q1 2025, Diamondback Energy noted that the cost for casing, a key drilling input, had actually increased over 10% due to steel tariffs. However, the overall trend, driven by the producer's capital discipline and lower realized prices, suggests that for most standardized services, Diamondback Energy holds the stronger hand right now. They are using their scale and reduced activity to push for better pricing.
Finance: draft 13-week cash view by Friday.
Diamondback Energy, Inc. (FANG) - Porter's Five Forces: Bargaining power of customers
You see the pressure from customers clearly when you look at realized prices, which are dictated by global markets, not just Diamondback Energy, Inc.'s excellent field operations. High global supply and geopolitical volatility keep crude oil prices volatile, for instance, the Q1 2025 unhedged realized price came in at $70.95/bbl. This commodity nature means that even with strong operational execution, the final realized value is out of your direct control, which is a major lever for buyers.
Honestly, while Diamondback Energy, Inc.'s customer base is diversified-think refiners, utilities, and midstream partners-the fact that oil and gas are fungible commodities severely limits the company's standalone pricing power. You can't charge a premium just because you drilled it well; you sell into the prevailing market. The company's management has definitely noted this, saying, 'We can't control the price of the product we produce.'
To counter this, Diamondback Energy, Inc. is actively securing demand through long-term contracts, especially for its natural gas volumes. A concrete example of this mitigation is the agreement to supply 50 million cubic feet per day for the Competitive Power Ventures (CPV) Basin Ranch project, a major 1,350-megawatt power plant. This locks in a buyer for a specific volume, indexed to power prices at ERCOT, which is a creative way to manage downstream risk.
Still, infrastructure bottlenecks in the Permian Basin give large customers-especially those buying gas into constrained local hubs-significant negotiating leverage over transportation and processing fees. Look at the Waha hub pricing in Q3 2025; the realized price there was just 75 cents/Mcf, a stark contrast to the Q1 2025 unhedged realized oil price of $70.95/bbl. This basin-specific constraint means Diamondback Energy, Inc. is consciously reducing its exposure to Waha, aiming to drop sales from over 70% of gas volumes down to just over 40% by the end of 2026.
Here's a quick look at how realized prices fluctuated, showing you the direct impact of market forces on Diamondback Energy, Inc.'s revenue streams:
| Metric | Period | Value |
|---|---|---|
| Unhedged Realized Oil Price | Q1 2025 | $70.95/bbl |
| Unhedged Realized Oil Price | Q2 2025 | $63.23/bbl |
| Unhedged Realized Natural Gas Price | Q1 2025 | $2.11/Mcf |
| Unhedged Realized Natural Gas Price | Q2 2025 | $0.88/Mcf |
| Waha Cash Price (Example of Local Pressure) | Q3 2025 | $0.75/Mcf |
You can also see how Diamondback Energy, Inc. is managing its asset base and counterparty exposure through strategic transactions, which affects who they deal with downstream:
- Completed divestiture of Environmental Disposal Systems for $694 million upfront cash (retaining 30% equity interest).
- Completed divestiture of 27.5% equity interest in EPIC Crude Holdings, LP for $504 million upfront cash.
- Viper Energy, a subsidiary, closed the acquisition of Sitio Royalties Corp. on August 19, 2025.
- The company has a current share repurchase authorization capacity of $8.0 billion (excluding excise tax).
Diamondback Energy, Inc. (FANG) - Porter's Five Forces: Competitive rivalry
You're looking at a rivalry in the Permian Basin that is absolutely fierce, focused squarely on who can pump a barrel of oil for the least amount of money while holding the best rock. Diamondback Energy, Inc. has been aggressively consolidating to keep pace with the majors, but the structural advantages held by players like ExxonMobil and Chevron are tough to ignore.
The intensity of this rivalry is best seen in the cost structure. Diamondback Energy, Inc. has consistently driven its unit operating expenses plus depreciation and amortization (DD&A) down to about $21/bbl as of late 2024/early 2025, which is well below the sector average of approximately $25/bbl. This cost leadership is critical when WTI oil prices averaged $66.65 per barrel in the first nine months of 2025. Honestly, the company's base dividend is protected down to a WTI price of approximately $37/Bbl, showing just how much cushion its efficiency provides against price dips.
Here's a quick look at how Diamondback Energy, Inc.'s cost position stacks up against its operational goals:
| Metric | Diamondback Energy, Inc. Value (2025 Data) | Context/Comparison |
| Adjusted Free Cash Flow per Share Growth (YTD) | ~7% more | Despite WTI strip pricing being ~14% below 2024 levels |
| Q3 2025 Adjusted Free Cash Flow per Share | $6.20 | Generated $1.8 billion in total adjusted free cash flow for the quarter |
| Median NPV25 Breakeven (Midland Basin) | $49.79/Bbl | Indicates the price needed for a 25-year net present value return |
| FCF Breakeven Price | Around $30/bbl | Lower than the base dividend protection price |
Still, you can't talk about rivalry without mentioning the giants. ExxonMobil and Chevron have a legacy advantage that is hard to match. Chevron, for instance, benefits from an advantage royalty position where mineral holdings benefit around 75% of its total Permian acreage, meaning they pay lower royalty rates or receive royalty barrels without committing capital. Chevron is targeting 1 million barrels of oil-equivalent per day (BOE/d) in 2025. Meanwhile, ExxonMobil's Permian production hit 1.185 million BOE/d in 2024, with plans to reach 2.3 million BOE/d by 2030. Diamondback Energy, Inc. is currently the third-largest producer in the Permian Basin, second only to these majors in the core Midland Basin.
Diamondback Energy, Inc.'s strategy is clearly about achieving scale to compete, evidenced by its recent major transactions. The projected production surge is a direct result of the Endeavor and Double Eagle acquisitions. Management increased the full-year 2025 total production guidance to a range of 910-920 thousand barrels of oil equivalent per day (MBOE/d). This scale-up is significant; for Q3 2025, revised guidance, including 43 days of contribution from the Sitio acquisition, was 908-938 MBOE/d. The company is using this scale to drive shareholder value, generating about 15% more free cash flow per share in 2025 even with oil prices down 14% year-to-date.
The depth and quality of inventory are what underpin Diamondback Energy, Inc.'s cost advantage over rivals with less premium acreage. You want to see the numbers on the runway ahead:
- Diamondback holds approximately 900,000 net acres in its Permian leasehold.
- The company has about 8,400 drilling locations economic at $50/bbl WTI.
- Total inventory is likely closer to 10,000 drilling locations.
- 61% of remaining Midland Basin locations are in tier-1 or tier-2 rock quality.
- At the current drilling pace, Diamondback has an implied inventory life of approximately 18.5 years.
This deep, high-quality inventory means Diamondback Energy, Inc. can maintain a competitive cost structure and production profile well into the future, which is the ultimate defense against intense rivalry in the basin.
Diamondback Energy, Inc. (FANG) - Porter's Five Forces: Threat of substitutes
You're analyzing the long-term viability of Diamondback Energy, Inc.'s core business against the backdrop of the energy transition. The threat of substitutes is definitely a major factor here, splitting clearly between the long-term structural shift and the near-term market realities.
Long-Term Structural Shift to Cheaper Renewables
The long-term threat is high because renewable power is becoming structurally cheaper than fossil fuels in many power markets. In 2024, on a levelized cost of electricity (LCOE) basis, 91% of newly commissioned utility-scale renewable capacity delivered power at a lower cost than the cheapest new fossil fuel alternative. For perspective, new utility-scale onshore wind projects had a global weighted average LCOE of $0.034/kWh in 2024, while solar PV was at $0.043/kWh. This cost advantage is stark; solar PV energy is now 75% cheaper than it was in 2014. Furthermore, the cost of battery energy storage systems (BESS) has declined by 93% since 2010, reaching $192/kWh for utility-scale systems in 2024. This progress resulted in renewables avoiding an estimated $467 billion in fossil fuel costs globally in 2024 alone. The pace of this transition means that renewables are poised to overtake coal as the leading power source in 2025.
The substitution threat is manifesting in several ways:
- Solar module prices fell 35% to less than 9 cents/kWh in 2024.
- The global EV fleet is projected to grow sixfold by 2035, displacing oil demand.
- In the IEA's STEPS scenario, global oil demand is projected to peak around 2030.
Near-Term Essentiality of Hydrocarbons
Near-term, the threat remains relatively low because oil and natural gas are still essential for transportation and petrochemicals, and demand growth persists in certain sectors. Global natural gas demand is on track to hit a record high in 2025, projected to climb by about 1.7% to around 4,193 bcm. This is supported by accelerating U.S.-led artificial intelligence data center growth, which accounted for an expected 1.7% of global electricity demand in 2025. For oil, while growth slowed to 0.8% in 2024, OPEC projects growth of 1.3 million barrels per day (bpd) in both 2025 and 2026. For Diamondback Energy, Inc., the near-term outlook for its primary product, natural gas, is actually supported by power demand, as the Henry Hub price is expected to average $4.00/MMBtu in 2026, a 16% increase from 2025.
Here's a quick look at the near-term commodity price and demand picture:
| Commodity/Metric | Value/Projection | Context/Date |
|---|---|---|
| Global Natural Gas Demand (2025 Est.) | ~4,193 bcm | Record high projection |
| U.S. LNG Exports Growth (2026 Est.) | Additional 10% increase | Driven by global demand |
| Brent Crude Price (2026 Avg. Est.) | $55/bbl | EIA Forecast |
| Henry Hub Natural Gas Price (2026 Avg. Est.) | $4.00/MMBtu | Up 16% from 2025 |
| Global Oil Demand Growth (2024) | 0.8% | Slower post-pandemic rebound |
Diamondback Energy, Inc.'s Adaptation Strategy
Diamondback Energy, Inc. is actively adapting by selling natural gas for power generation, capitalizing on the high electricity demand from data centers and the AI buildout in the Permian Basin. The company is in talks to form a power joint venture to supply electricity to AI data centers on its acreage. Diamondback Energy, Inc. operates on 65,000 surface acres in the Permian. This strategy directly addresses the low realized price for its gas; for instance, the company recorded an average realized natural gas price of negative 26 cents/Mcf in Q3 2024. The potential upside is significant, as U.S. data centers' energy needs could boost gas demand by between 3 billion and 6 billion cubic feet per day (bcfd).
The company's planned involvement includes:
- Seeking an equity stake in a gas-fired power plant.
- Supplying its own natural gas to the plant.
- Receiving some of the generated power for its own field operations.
- Providing produced water for data center cooling.
Long-Term Demand Destruction Risk
Despite the near-term gas demand strength, global decarbonization efforts and stricter environmental regulations pose a significant long-term demand destruction risk for all hydrocarbon products. Nearly three-fourths of the world's greenhouse gas emissions since 2020 have come from coal, oil, and gas. While the IEA's central case (STEPS) suggests oil demand may peak around 2030 and gas demand by 2035, more aggressive scenarios show steeper declines. For example, in the net-zero scenario, the price of oil could fall to $33/bbl by 2035. The COP30 summit in late 2025 resulted in a compromise that largely skipped mandatory tightening targets for reducing fossil fuel emissions, but the underlying pressure remains a structural headwind for long-life hydrocarbon assets.
Diamondback Energy, Inc. (FANG) - Porter's Five Forces: Threat of new entrants
You're looking at the barriers to entry in the Permian Basin right now, and honestly, the deck is stacked heavily in favor of established players like Diamondback Energy. The threat from new entrants is decidedly low, primarily because the sheer scale of capital required to compete meaningfully is astronomical.
Consider Diamondback Energy's own spending plans. For the full year 2025, the company has guided its capital expenditures (CAPEX) to a range of $3.4-$3.6 billion. That figure alone represents a massive hurdle for any startup trying to acquire acreage, secure drilling rigs, and build out the necessary midstream and environmental infrastructure to operate efficiently. This high capital intensity immediately filters out most potential competitors before they even start.
The best real estate in the basin-the premium, contiguous Tier-1 acreage-is already locked up. Years of aggressive M&A activity mean that the prime sweet spots in the Delaware and Midland sub-basins are consolidated among majors and super-independents. To compete on scale and efficiency, a new entrant would need to pay exorbitant prices for fringe acreage or attempt a major acquisition, which itself requires billions in capital and faces intense scrutiny in the current M&A environment.
Then you have the regulatory overhead. Compliance costs act as a significant, non-negotiable barrier favoring large, established operators. For instance, the evolving EPA methane rules create substantial operational and financial burdens. While the Trump administration finalized extensions that could save the industry an estimated $750 million in compliance costs over 11 years, the underlying requirements for monitoring and equipment upgrades still favor companies with the balance sheets to absorb them. Furthermore, high emitters face a Waste Emissions Charge (WEC) starting at $1,200/tonne for 2025 methane emissions. Diamondback Energy's scale allows it to spread these fixed compliance costs over a much larger production base, giving it a cost advantage over smaller, less diversified firms.
Here's a quick look at the scale differences:
| Metric | Value (2025 Estimate/Guidance) | Context |
|---|---|---|
| Diamondback Energy Full-Year 2025 CAPEX Range | $3.4-$3.6 billion | Capital required for large-scale development |
| Diamondback Energy 2025 Average Lateral Length Guidance | ~11,500 feet | Indicates focus on large-scale horizontal wells |
| Estimated Methane Waste Emissions Charge (WEC) for 2025 | $1,200/tonne | Cost barrier for high emitters |
| Small Operator Niche Entry Commitment (Vertical Wells) | $20,000 to $50,000 | Minimal capital for niche entry |
To be fair, there is a small, low-capital entry point. Smaller operators can certainly enter niche markets by focusing on shallow, vertical wells, which require far less upfront investment, sometimes with commitments as low as $20,000 to $50,000. These vertical plays can be profitable at lower price decks and are great for generating stable, albeit small, cash flow. Still, these niche players pose minimal threat to Diamondback Energy's core business model, which is built around high-efficiency, large-scale horizontal development, evidenced by their 2025 average lateral length guidance of approximately 11,500 feet. The economics simply don't scale to challenge a company of Diamondback Energy's size.
The barriers to entry-capital, acreage consolidation, and regulatory compliance-create a moat that is defintely wide. Finance: draft 13-week cash view by Friday.
Disclaimer
All information, articles, and product details provided on this website are for general informational and educational purposes only. We do not claim any ownership over, nor do we intend to infringe upon, any trademarks, copyrights, logos, brand names, or other intellectual property mentioned or depicted on this site. Such intellectual property remains the property of its respective owners, and any references here are made solely for identification or informational purposes, without implying any affiliation, endorsement, or partnership.
We make no representations or warranties, express or implied, regarding the accuracy, completeness, or suitability of any content or products presented. Nothing on this website should be construed as legal, tax, investment, financial, medical, or other professional advice. In addition, no part of this site—including articles or product references—constitutes a solicitation, recommendation, endorsement, advertisement, or offer to buy or sell any securities, franchises, or other financial instruments, particularly in jurisdictions where such activity would be unlawful.
All content is of a general nature and may not address the specific circumstances of any individual or entity. It is not a substitute for professional advice or services. Any actions you take based on the information provided here are strictly at your own risk. You accept full responsibility for any decisions or outcomes arising from your use of this website and agree to release us from any liability in connection with your use of, or reliance upon, the content or products found herein.