
|
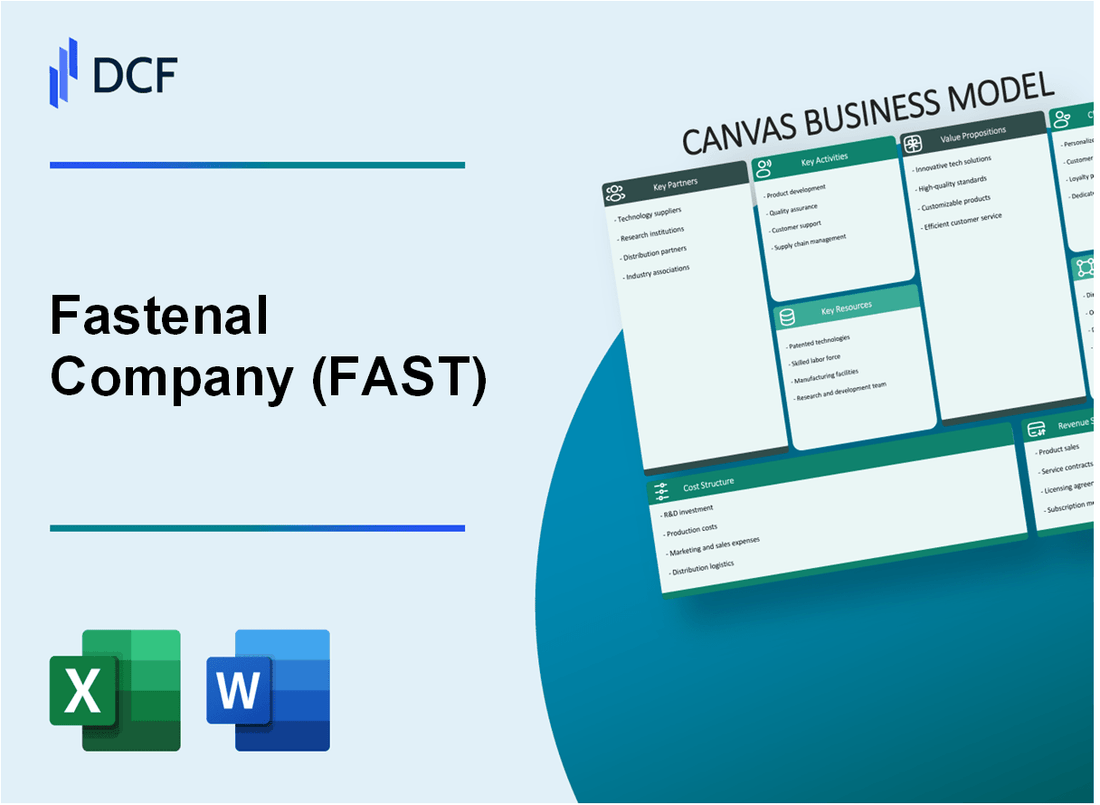
Fastenal Company (FAST): Business Model Canvas [Dec-2025 Updated] |
Fully Editable: Tailor To Your Needs In Excel Or Sheets
Professional Design: Trusted, Industry-Standard Templates
Investor-Approved Valuation Models
MAC/PC Compatible, Fully Unlocked
No Expertise Is Needed; Easy To Follow
Fastenal Company (FAST) Bundle
You're looking to understand how a distributor like Fastenal Company is actually winning market share in this environment, and honestly, it comes down to their inventory control strategy. Forget just stocking shelves; their model hinges on embedding supply chain expertise right at the customer's point-of-use, driven by nearly $\mathbf{134,000}$ FMI vending devices globally, which now account for $\mathbf{45.3\%}$ of their Q3 2025 sales. This focus on sticky relationships is real, evidenced by $\mathbf{73.2\%}$ of Q2 2025 revenue coming from long-term contracts, all while managing over $\mathbf{1.2 \text{ million}}$ unique product SKUs from their massive network. Dive into the full Business Model Canvas below to see precisely how their Key Activities and Cost Structure support this high-value, decentralized approach.
Fastenal Company (FAST) - Canvas Business Model: Key Partnerships
You're looking at the backbone of Fastenal Company's distribution strength-the relationships that keep the product flowing from the source to the point of use. These partnerships are crucial for maintaining their 'high-touch, high-tech' approach.
The foundation rests on a vast network of external collaborators:
- - Global network of over 3,000 industrial product suppliers.
- - Strategic logistics and freight carriers for national distribution.
- - Technology vendors for FMI vending hardware and software.
- - Domestic and international fastener manufacturers for core products.
The scale of Fastenal Company's physical presence is supported by its logistics and sourcing partners. They operate approximately 1,600 branch locations across 25 countries, which helps them embed their service model locally. To manage the flow of goods to these locations and directly to customers, they focus heavily on optimizing supply chain partnerships. Contract-based sales, which rely on these deep partnerships, grew 11% in Q2 2025, making up 73.2% of total revenue, up from 71.2% the prior year.
The technology partnerships, especially around Fastenal Managed Inventory (FMI), are a major driver of recent growth. The company stated it uses primarily one supplier for its industrial vending equipment. This FMI technology suite, which includes vending machines and sensor-equipped bins, is central to their digital footprint. As of Q3 2025, sales through FMI technology grew 18% year-over-year, representing 45.3% of total sales. They were signing about 110 new FMI devices daily, pushing the installed base to almost 134,000 globally. For the full year 2025, the goal for weighted FASTBin and FASTVend device signings was set between 25,000 and 26,000 MEU (Machine Equivalent Units).
The nature of Fastenal Company's product mix shows how critical their core fastener manufacturing partners are, even as non-fastener sales grow. Fasteners, one of their biggest revenue generators, represented 30.3% of total sales in Q1 2025, down from 31.5% the year before. Conversely, non-fastener sales increased to 69.7% of total sales in that same quarter.
Here's a quick look at how the product mix and digital engagement tie into the overall revenue picture as of late 2025:
| Metric | Value/Percentage | Period/Context |
| FMI Technology Sales Share | 45.3% | Q3 2025 Total Sales |
| Total Installed FMI Devices | Almost 134,000 | As of Q3 2025 |
| Weighted FASTBin/FASTVend Signings Goal | 25,000 to 26,000 MEU | Full Year 2025 |
| Fastener Sales Share | 30.3% | Q1 2025 Total Sales |
| Non-Fastener Sales Share | 69.7% | Q1 2025 Total Sales |
| Contract-Based Sales Share | 73.2% | Q2 2025 Total Revenue |
The company's success is tied to its ability to manage this complex web, ensuring that the primary supplier for core products and the technology vendor for FMI hardware work seamlessly with their logistics network. If onboarding new FMI devices slows down, it directly impacts the growth of that 45.3% revenue segment.
Finance: review the Q4 2025 inventory purchase commitments with top-tier fastener manufacturers by next Tuesday.
Fastenal Company (FAST) - Canvas Business Model: Key Activities
You're looking at the core engine of Fastenal Company (FAST) operations, the things they absolutely must do well to keep the revenue machine running. This isn't about what they sell, but how they execute the selling and delivery process, especially as they push harder into digital channels.
Managing the Fastenal Managed Inventory (FMI) program expansion is a massive activity, central to their embedded strategy. This involves deploying and servicing the technology that automates customer inventory replenishment.
- In the third quarter of 2025, Fastenal Company signed 7,050 weighted devices under the FMI Technology program.
- The installed base of these devices grew to 133,910 units globally as of Q3 2025, an 8.7% increase year-over-year from Q3 2024.
- Sales flowing through FMI Technology represented 45.3% of total sales in Q3 2025, with that segment growing 18% year-over-year.
- The company maintained its full-year 2025 goal to deploy between 25,000 and 26,000 machine equivalent units (MEUs).
- As of Q1 2025, the FMI technology footprint included approximately 130,000 devices across 25 countries, marking a 12.5% growth in device count.
Global sourcing and supply chain optimization to mitigate tariff impacts is a constant balancing act, especially given the trade policy environment.
| Metric | Q3 2025 Value | Comparison/Context |
| Pricing Impact on Net Sales | 2.5 percentage points increase | In Q3 2025. |
| Gross Margin | 45.3% | Up from 44.9% in Q3 2024. |
| Operating Margin | 20.7% | In line with the same quarter last year. |
| Direct Materials as % of YTD Sales | 38.8% | Fasteners accounted for 20.9% of this. |
Securing and growing large, long-term customer contracts drives the most reliable revenue streams.
- Contract customer sales surged 13.2% in Q3 2025.
- Contract customers represented 73.8% of total sales in Q3 2025, up from 72.0% in Q3 2024.
- Non-contract customer sales growth lagged at 7.2% in the same quarter.
- In November 2025, daily sales growth for contract customers was +13.0%.
- Customer sites spending $10,000+ per month accounted for 82.1% of sales in 3Q25, up from 79.4% in 3Q24.
- In 2024, there were 9,440 customers spending $10,000.00+ per month.
Operating and stocking the extensive in-market branch network remains the physical backbone supporting the digital push.
- Fastenal ended November 2025 with a total headcount of 24,595.
- Full-time selling personnel headcount at the end of November 2025 was 15,452.
- As of 2024, the total number of locations was 3,628.
- In November 2025, 62.9% of in-market locations were reporting growth.
Developing e-business platforms for digital sales growth is critical for efficiency and market reach.
- The combined Digital Footprint (eBusiness plus FMI) reached 61.3% of total sales in Q3 2025.
- E-business daily sales rose 8.0% in Q3 2025, representing 29.1% of total sales.
- In November 2025, eBusiness daily sales growth was +7.0%.
- The company had a target to reach 66% to 68% of sales through the Digital Footprint by October 2025.
Fastenal Company (FAST) - Canvas Business Model: Key Resources
You're looking at the core assets that let Fastenal Company deliver its value proposition, and honestly, the numbers here tell a story of deep operational integration. These aren't just things they own; they are the mechanisms that lock customers into their ecosystem.
The physical and digital infrastructure is massive. You've got an installed base of almost 134,000 FMI devices globally. That number is the physical manifestation of their strategy to be inside the customer's operation. To be fair, the Q3 2025 filing showed the installed base specifically at 133,910 units, showing consistent growth of 8.7% year-over-year as of that period.
Fastenal Company maintains an extensive inventory of over 1.2 million unique product SKUs. This breadth is critical for a one-stop shop in industrial and construction supplies. Supporting this physical network is a significant footprint:
- - Installed base of almost 134,000 FMI devices globally.
- - Extensive inventory of over 1.2 million unique product SKUs.
- - Proprietary FMI technology and e-business platforms.
- - Network of distribution centers and local in-market locations.
- - Highly trained local sales and service personnel.
The proprietary technology is where the real leverage is starting to show. The combination of FMI technology and e-business platforms-what Fastenal calls its Digital Footprint-accounted for 61.3% of total sales in Q3 2025. That's a huge chunk of revenue flowing through automated channels.
Here's a quick look at how those digital assets are performing as of the third quarter of 2025:
| Key Digital Metric | Value (Q3 2025) | Context/Growth |
| Installed FMI Devices (Units) | 133,910 | Up 8.7% year-over-year |
| Sales via FMI Technology (% of Total Sales) | 45.3% | Grew 18% year-over-year |
| eBusiness Daily Sales Growth | 8.0% | Represents 29.1% of total sales |
| Customer Sites Spending $50k+ per Month | Growth of 15.4% | Subset of large accounts |
The physical distribution backbone is built on a global scale. Fastenal Company operates with approximately 1,600 branch locations spanning 25 countries. Domestically, as of September 17, 2025, there were 1,219 Fastenal locations in the United States alone. These branches are supported by a network of high-tech logistics hubs. For instance, they operate about 17 distribution centers globally, including facilities in Canada, Europe, and Mexico, which serve as the logistics core for the local service model.
The final, and perhaps most critical, resource is the human element. While I don't have a precise headcount for late 2025, the strategy relies on highly trained local sales and service personnel. These teams are the ones executing the 'high-touch' part of the 'high-touch, high-tech' approach, driving contract signings and managing the relationships that keep the FMI devices growing. For example, the company signed about 110 new FMI devices per day in Q3 2025, a direct result of that local sales effort.
Fastenal Company (FAST) - Canvas Business Model: Value Propositions
You're looking at the core value Fastenal Company (FAST) delivers to its customers, which is heavily anchored in inventory control and supply chain integration, as of late 2025.
Point-of-use inventory management via FMI, reducing customer downtime.
- Sales through Fastenal Managed Inventory (FMI) technology accounted for 45.3% of total sales in Q3 2025.
- The installed base of FMI devices reached almost 134,000 globally in Q3 2025.
- In the second quarter of 2025, the installed base of FMI devices was 132,174, marking a 10.8% year-over-year increase.
- The company signed 6,458 weighted FASTBin and FASTVend devices in Q2 2025.
- The goal for weighted FASTBin and FASTVend device signings in 2025 was set between 25,000 to 26,000 MEU.
Single-source supplier for MRO, safety, and fastener products.
Fastenal Company's product mix performance in the third quarter of 2025 showed specific category dynamics:
| Product Category | DSR Change (Q3 2025 vs Q3 2024) | % of Sales (Q3 2025) |
| Fasteners | Not explicitly stated as a single number | 46.9% |
| Safety | 6.8% | 22.1% |
| Other product lines | 10.7% | 30.9% (Calculated: 100% - 46.9% - 22.1%) |
The fastener category experienced improved growth in Q3 2025 compared to Q3 2024. Safety category growth reflected lower volatility of PPE demand, which is utilized more in MRO applications.
Embedded supply chain expertise through Onsite locations.
The success of the Key Account Strategy, which heavily features Onsite-like solutions, is evident in customer spending tiers:
- In Q2 2025, customer sites generating $10,000+ in monthly sales grew by 6.7%.
- These high-volume customer sites accounted for 81.4% of net sales in Q2 2025.
- Onsite-like locations saw an increase of 12.4% in Q2 2025.
- In Q3 2025, there were 2,304 Manufacturing customer sites spending $50k+/Mo.
Cost reduction and process savings for large industrial customers.
The value proposition is realized through the performance of the manufacturing segment, which benefits most from the service model:
- Manufacturing end markets outperformed in Q3 2025 due to strength with key account customers where the service model and technology are particularly impactful.
- Manufacturing customers represented 75% of Fastenal Company's end market business in Q2 2025.
- Net sales increased 11.7% in Q3 2025 compared to Q3 2024.
- For the first nine months of 2025, sales increased 7.9% to $6.17 billion.
Local service and rapid fulfillment through decentralized network.
The network structure reflects a strategic shift toward technology-enabled fulfillment:
- Fastenal Company's branch footprint was around 1,200 locations as of late 2025.
- This is a reduction from over 2,700 branches a decade prior.
- Digital sales, combining e-business and FMI, exceeded 60% of total revenue in Q3 2025, reaching 61.3%.
Fastenal Company (FAST) - Canvas Business Model: Customer Relationships
You're looking at how Fastenal Company (FAST) locks in its customers, and honestly, it's a dual strategy: deep integration for the big spenders and high-volume automation for everyone else. The foundation of this stickiness is the long-term contract, which is clearly working. Contract-based sales were a massive 73.2% of Q2 2025 revenue, showing an 11% increase for that segment during the quarter. That's not accidental; they signed 84 new contracts in Q2 2025 alone, pushing the total contract count to 3,446 as of that quarter's end, a 9.5% jump year-over-year. That's how you build a durable revenue base.
The automated, transactional relationship is where the technology really shines, moving the relationship beyond simple ordering. This is driven by Fastenal Managed Inventory (FMI) and e-business channels. The goal is clearly to embed the product right where the customer uses it, making replenishment automatic. Here's a quick look at how the digital relationship scaled between Q2 and Q3 2025:
| Metric | Q2 2025 Value | Q3 2025 Value |
| FMI Sales as % of Revenue | 44.1% | 45.3% |
| E-business Sales as % of Revenue | 30.0% (approx.) | 29.1% |
| Total Digital Footprint (% of Sales) | 61% | 61.3% |
| Total FMI Devices Installed (Global) | 132,174 units | Almost 134,000 units |
The FMI program, which includes vending machines and sensor-equipped bins, is the core of the dedicated service model for high-value contract customers. In Q3 2025, sales through FMI technology grew 18% year-over-year. The company was aggressively adding hardware, signing about 110 new FMI devices per day in Q3 2025, and they had a plan to deploy between 25,000 and 26,000 additional devices throughout 2025. To be fair, the growth in sites spending over $10,000 per month in Q2 2025 was 11.6%, showing where that dedicated onsite effort is focused.
For the transactional side, e-business sales, which cover procurement systems and the company's website, represented 29.1% of total revenue in Q3 2025, up 8% from the prior year. The combined digital footprint, which is the sum of FMI and e-business, hit 61.3% of total sales in Q3 2025. This high-tech approach is layered on top of the personalized service from local staff.
The personalized service element relies on the physical network. Fastenal Company operates approximately 1,600 branch locations spanning 25 countries. You still need local experts and inventory to support those high-tech deployments and handle immediate needs. The company's strategy is to use this local presence to support its larger, embedded customers while also serving smaller customers, though they noted plans to relaunch fastenal.com later in 2025 to better serve those smaller accounts.
The stickiness is evident in the spend profile of their top customers:
- - Customers spending $50,000 or more monthly saw sales grow 14.5% in Q2 2025.
- - The site count for that top tier grew 12.4% in Q2 2025.
- - Contract customer sales grew 11% in Q2 2025.
- - The company signed 84 new contracts in Q2 2025.
Finance: draft the Q3 2025 cash flow impact analysis from the FMI device deployment pace by Monday.
Fastenal Company (FAST) - Canvas Business Model: Channels
You're looking at how Fastenal Company (FAST) gets its products to the customer, and the numbers show a clear pivot away from the traditional storefront model.
Fastenal Managed Inventory (FMI) devices (vending/FASTBin) are a massive part of the current channel mix. Sales through FMI technology grew 18% year-over-year in Q3 2025, making up 45.3% of total sales for that quarter. The installed base reached almost 134,000 devices globally by Q3 2025, with the company signing about 110 new FMI devices per day. For the first six months of 2025, FMI revenue totaled $1.79 billion. The goal for weighted FASTBin and FASTVend device signings in 2025 is 25,000 to 26,000 MEU.
Customer-specific Onsite locations (embedded supply chain) are closely linked to the FMI success, focusing on the largest accounts. Customer sites spending $10,000 or more per month saw revenue growth of 11.6% in Q2 2025. The segment of customers spending $50,000 or more monthly expanded its site count by 12.4% in Q2 2025. Growth in unit sales in Q3 2025 was attributed to the increase in these $10k+ per month customer sites.
E-business platforms (EDI and Fastenal.com) are the other half of the digital push. In Q3 2025, e-business sales rose 8% and represented 29.1% of total revenue. This is up from Q2 2025, where e-business sales increased 13.5% and accounted for more than 30% of total revenue. For the month of November 2025, daily sales growth for eBusiness was reported at 7.0%.
The combined Digital Footprint sales-e-business plus FMI-reached 61.3% of total sales in Q3 2025. The company's stated goal was to exit 2025 with 63% to 64% of revenue under this digital footprint.
In-market branches (traditional local sales and service) are being strategically deemphasized relative to digital channels. Fastenal's branch footprint was around 1,200 as of 2025, down from eclipsing 2,700 ten years prior. Still, about 80%-85% of Selling Personnel (FTE as of November 2025) are attached to a specific in-market location.
The focus on large accounts ties into the Direct sales force targeting $10k+ monthly spend accounts. The growth in unit sales in Q3 2025 was driven by the growth in customer sites spending $10k or more per month. Furthermore, 71.0% of the Top 100 national accounts were growing in November 2025.
Here's a quick look at the channel performance metrics from the mid-to-late 2025 reporting periods:
| Channel Metric | Period/Date | Value/Percentage |
| Digital Footprint Sales (% of Total Sales) | Q3 2025 | 61.3% |
| FMI Technology Sales (% of Total Sales) | Q3 2025 | 45.3% |
| E-business Sales (% of Total Revenue) | Q3 2025 | 29.1% |
| eBusiness Daily Sales Growth | November 2025 | 7.0% |
| FMI Device Install Base (Global) | Q3 2025 | Almost 134,000 |
| New FMI Devices Signed per Day | Q3 2025 | About 110 |
| Customer Sites Spending $10k+ Monthly Revenue Growth | Q2 2025 | 11.6% |
| Top 100 National Accounts Growing | November 2025 | 71.0% |
The company also reported that 61.3% of total sales in Q3 2025 came from its digital footprint. For the first nine months of 2025, total sales were $6.17 billion.
- Sales through FMI technology grew 18% year-over-year in Q3 2025.
- E-business sales grew 8% in Q3 2025.
- The company signed 110 new FMI devices per day in Q3 2025.
- In-market locations growing (as of Nov-25): 62.9%.
Fastenal Company (FAST) - Canvas Business Model: Customer Segments
You're looking at how Fastenal Company (FAST) structures its customer base right now, late in 2025. It's a clear focus on high-volume, embedded relationships, though smaller customers still matter.
The largest portion of the business comes from the manufacturing sector, which is a combination of heavy and other manufacturing end markets. For November 2025 daily sales, these segments together accounted for 75.4% of sales, broken down into Heavy Manufacturing at 43.1% and Other Manufacturing at 32.3%. This concentration shows where the core value proposition is currently landing strongest.
Contract Customers are definitely the primary growth focus, as evidenced by their daily sales growth. In November 2025, daily sales growth for contract customers was 13.0%, matching October's growth rate of 13.0%. This strategy is paying off, as contract-based sales represented 73.2% of total revenue in Q2 2025, up from 71.2% a year prior. This segment includes national account, government, and local contracts.
Beyond core manufacturing, Fastenal Company sees significant activity in Non-Residential Construction and the broader Other End Markets, which includes data centers. Non-residential construction represented 8.0% of November 2025 daily sales, showing growth of 8.4% year-over-year for that month. The Other End Markets category, which houses data centers, made up 16.6% of November 2025 daily sales, with revenue from large non-manufacturing customers jumping 30% year-over-year in Q2 2025.
The company heavily targets High-Value Sites spending $10,000+ per month. In the third quarter of 2025, these sites accounted for 82.1% of total sales, an increase from 79.4% in Q3 2024. The growth in the number of these $10k+ sites was up 8.1% year-over-year in Q3 2025. Even more valuable are the $50,000+ monthly spending sites, which grew their site count by 15.4% in Q3 2025.
Small-to-Midsize Businesses are served through the branch network and e-commerce channels, though the focus is clearly on the larger accounts. Digital sales, which serve this broader base, accounted for over 60% of total sales in Q3 2025. Daily sales growth for non-contract customers in November 2025 was 8.0%, while eBusiness daily sales growth was 7.0%.
Here is a snapshot of the end market distribution based on November 2025 daily sales percentages:
| End Market Segment | % of November 2025 Daily Sales | November 2025 Daily Sales YoY Growth |
| Heavy Manufacturing | 43.1% | 13.0% |
| Other Manufacturing | 32.3% | 12.9% |
| Non-residential Construction | 8.0% | 8.4% |
| Other End Markets (incl. Data Centers) | 16.6% | 8.1% |
The performance metrics across key customer channels for November 2025 daily sales show the following:
- Daily sales growth - contract customers: 13.0%.
- Daily sales growth - non-contract customers: 8.0%.
- % of Top 100 national accounts growing: 71.0%.
- % of in-market locations growing: 62.9%.
- Daily sales growth - FMI (Fastenal Managed Inventory): 17.0%.
- Daily sales growth - eBusiness: 7.0%.
If onboarding takes 14+ days for a new major account, churn risk rises, honestly.
Finance: draft 13-week cash view by Friday.
Fastenal Company (FAST) - Canvas Business Model: Cost Structure
You're looking at the core expenses that keep Fastenal Company's industrial and construction supplies distribution machine running. The cost structure is heavily weighted toward the people who serve the customers and the inventory needed to fulfill those immediate needs.
Cost of Goods Sold (COGS) for industrial and construction supplies.
The cost of the products themselves is the largest single expense category. For the twelve months ending September 30, 2025, Fastenal Company's Cost of Goods Sold was reported at $4.387B. This figure reflects the direct cost of the industrial and construction supplies sold to customers.
Employee-related expenses (70% to 75% of SG&A).
Personnel costs are the dominant component within Selling, General & Administrative (SG&A) expenses. These expenses include payroll, cash compensation, stock option expense, profit sharing, health care, personnel development, and social taxes. For instance, in the fourth quarter of 2024, employee-related expenses represented 70% to 75% of total SG&A expenses, increasing 3.1% year-over-year due to higher average Full-Time Equivalents (FTE) and wages, plus rising health insurance costs.
Capital expenditure for FMI devices and distribution hubs (FY2025 guidance: $265M-$285M).
Significant capital investment is required to support the digital strategy and logistics backbone. Fastenal Company's full-year Capital Expenditure guidance for Fiscal Year 2025 is set between $265M and $285M. For context, the actual capital expenditures in the first quarter of 2025 totaled $53.8 million. These investments fund the expansion of Fastenal Managed Inventory (FMI) devices and major distribution center projects, such as the completion of the Utah hub and the start of construction on the Atlanta hub.
Operating costs for the extensive branch and Onsite network.
The physical footprint is a major operating cost driver, encompassing occupancy and selling-related transportation. As of the 2024 Annual Report, Fastenal supported its operations with a network of 3,628 in-market selling locations across 25 countries. Occupancy-related expenses, which include building rent, depreciation, utility costs, and equipment related to branches and distribution locations, typically account for 15% to 20% of total SG&A expenses. Furthermore, selling-related transportation costs are significant, with approximately 90% of product tonnage between hubs and in-market locations moved by the captive logistics fleet, which operated approximately 490 trucks as of year-end 2024.
The breakdown of SG&A expenses illustrates this cost concentration:
| SG&A Component | Approximate Percentage of Total SG&A (Recent Periods) | Cost Driver Examples |
| Employee-related expenses | 70% to 75% | Wages, benefits, profit sharing, health insurance |
| Occupancy-related expenses | 15% to 20% | Branch rent, utility costs, FMI hardware depreciation |
| All other SG&A expenses | 10% to 15% | Selling-related transportation, IT spending, general insurance |
Inventory holding and logistics costs.
Maintaining high product availability, especially for same-day access, necessitates substantial inventory investment, which impacts working capital and holding costs. In 2024, 59% of Fastenal's $1.6B inventory was staged locally or within customer sites for immediate access. Proactive inventory building to support customer growth and mitigate tariff risks has been a focus; for example, inventory increased by 11.9% year-over-year leading into 2025, and inventory grew by 14.7% year-over-year in the second quarter of 2025. Logistics costs are also influenced by efforts to manage tariffs, which sometimes involves redirecting imports directly into Canada or Mexico, potentially leading to more fragmented and expensive shipments compared to standard U.S. import routes.
The non-employee portion of SG&A, categorized as All other SG&A expenses, typically ranges from 10% to 15% of total SG&A. This bucket includes variable costs like selling-related transportation, which saw higher lease costs from fleet refreshment, and elevated IT spending for digital capability projects.
Fastenal Company (FAST) - Canvas Business Model: Revenue Streams
You're looking at how Fastenal Company (FAST) converts its operational strength into dollars, which is key to understanding its valuation, especially given the recent market focus on growth versus margin.
The revenue streams are heavily weighted toward the core distribution of maintenance, repair, and operations (MRO) supplies, but the growth engine is clearly the embedded technology services. Honestly, the shift toward these high-touch, automated solutions is what management is betting on to secure future revenue predictability.
Here's the quick math on how the revenue streams broke down based on the latest available data points:
- - Direct Sales of MRO and Safety products (69.4% of November 2025 sales).
- - Fastener Sales (approximately 30.6% of November 2025 sales).
- - Sales from FMI/Vending programs (45.3% of Q3 2025 sales).
- - Revenue from large contract customers (driving 11.7% Q3 2025 sales growth).
- - Price increases initiated in 2025 contributing to revenue uplift.
The pricing actions taken throughout 2025 definitely helped buffer costs. For instance, the impact of product pricing on net sales in the third quarter of 2025 was an increase of 240 to 270 basis points compared to the prior year period, where pricing impact was not material. This follows earlier pricing realization in Q2 2025, where three pricing actions were intended to contribute 3% to 4% price realization.
The embedded technology, which Fastenal calls its Digital Footprint, is a massive component of the revenue base. In Q3 2025, this Digital Footprint, combining eBusiness and FMI technology sales, reached 61.3% of total sales. Sales specifically through FMI Technology (FASTStock, FASTBin, and FASTVend) accounted for 45.3% of total sales in Q3 2025.
The growth from the largest customers is a major revenue driver. In Q3 2025, net sales overall grew 11.7% year-over-year, performance management pointed to the contribution from improved customer contract signings. Daily sales growth for contract customers specifically was 13.0% in November 2025, outpacing the 8.0% growth seen in non-contract customers that month. Furthermore, the number of sites spending $50K or more monthly grew by 15.4% in Q3 2025.
To give you a clearer picture of the recent monthly and quarterly performance metrics that feed these revenue streams, look at this breakdown:
| Metric | Period | Value/Rate | Context/Comparison |
| Net Sales | November 2025 | $627.54 million | Up 6.2% versus November 2024 |
| Daily Sales Growth | November 2025 | 11.8% | Up from 3.4% in November 2024 |
| Net Sales Growth | Q3 2025 | 11.7% | Up $223.2 million versus Q3 2024 |
| FMI Technology Sales (% of Total Sales) | Q3 2025 | 45.3% | Sales through FMI Technology |
| Fastener Daily Sales Growth | November 2025 | 14.6% | Up from 0.1% in November 2024 |
| Contract Customer Daily Sales Growth | November 2025 | 13.0% | Versus 7.0% for contract customers in November 2024 |
The product line split for November 2025 shows Fasteners at 30.6% of sales, with Safety supplies at 22.4%, and Other products making up the remaining 47.0%. This implies that the MRO and Safety component, as defined in your outline, is the complement to fasteners, which aligns with the required 69.4% figure.
Finance: draft 13-week cash view by Friday.
Disclaimer
All information, articles, and product details provided on this website are for general informational and educational purposes only. We do not claim any ownership over, nor do we intend to infringe upon, any trademarks, copyrights, logos, brand names, or other intellectual property mentioned or depicted on this site. Such intellectual property remains the property of its respective owners, and any references here are made solely for identification or informational purposes, without implying any affiliation, endorsement, or partnership.
We make no representations or warranties, express or implied, regarding the accuracy, completeness, or suitability of any content or products presented. Nothing on this website should be construed as legal, tax, investment, financial, medical, or other professional advice. In addition, no part of this site—including articles or product references—constitutes a solicitation, recommendation, endorsement, advertisement, or offer to buy or sell any securities, franchises, or other financial instruments, particularly in jurisdictions where such activity would be unlawful.
All content is of a general nature and may not address the specific circumstances of any individual or entity. It is not a substitute for professional advice or services. Any actions you take based on the information provided here are strictly at your own risk. You accept full responsibility for any decisions or outcomes arising from your use of this website and agree to release us from any liability in connection with your use of, or reliance upon, the content or products found herein.