
|
Freeport-McMoRan Inc. (FCX): BCG Matrix [Dec-2025 Updated] |
Fully Editable: Tailor To Your Needs In Excel Or Sheets
Professional Design: Trusted, Industry-Standard Templates
Investor-Approved Valuation Models
MAC/PC Compatible, Fully Unlocked
No Expertise Is Needed; Easy To Follow
Freeport-McMoRan Inc. (FCX) Bundle
You're looking for a clear-eyed view of Freeport-McMoRan's portfolio right now, and honestly, the BCG Matrix is the perfect tool given the volatility around Grasberg and the massive copper tailwinds we're seeing into late 2025. We need to see where the $4.3 billion in cash and the $5.5 billion in stable cash flow from Cash Cows like Cerro Verde are supporting the high-growth Stars, like North America Copper benefiting from a 28% COMEX price premium. Still, we must also face the Question Marks, especially the near-term copper production hit from the September mud rush incident, which contrasts sharply with the long-term potential of projects like the El Abra Sulfide Expansion. Let's break down which assets are funding the future and which ones are just draining capital.
Background of Freeport-McMoRan Inc. (FCX)
Freeport-McMoRan Inc., often just called Freeport, is a major American mining company headquartered in Phoenix, Arizona. You know them as a leading global producer of copper, gold, and molybdenum. They are recognized as the world's largest producer of molybdenum and operate the Grasberg mine in Papua, Indonesia, which is the world's largest gold mine. Freeport-McMoRan Inc. is a component of the S&P 500 index.
The company's operational footprint is spread across North America, South America, and Indonesia. For instance, in 2024, Freeport-McMoRan Inc. sold about 1.2 million metric tons of copper and approximately 900,000 ounces of gold. They hold significant stakes in key assets, including a 49% ownership in the Grasberg operations, 55% of the Cerro Verde mine in Peru, and 72% of Morenci in Arizona. The company has substantial copper reserves, estimated to cover about 25 years at the end of December 2024.
Financially, Freeport-McMoRan Inc. has seen a dynamic 2025. For the third quarter of 2025, the company reported revenues of $6.97 billion, with adjusted earnings per share reaching $0.50. This performance was supported by a favorable copper price realization, hitting $4.68 per pound in Q3. In the second quarter of 2025, they achieved a unit net cash cost of just $1.13 per pound of copper, which was a significant improvement over prior periods. The company also marked a strategic milestone with the early startup of its new copper smelter in Indonesia.
However, the latter half of 2025 brought operational headwinds. A tragic mud rush incident at the Grasberg Block Cave underground mine in Indonesia on September 8, 2025, resulted in seven fatalities and a temporary suspension of mining. This event reduced the third-quarter production by an estimated 90 million pounds of copper and 80 thousand ounces of gold. Consequently, the company's full-year 2025 sales guidance was revised downward for copper and gold compared to earlier projections. Looking at the full fiscal year 2025, Zacks Consensus Estimates project total revenue around $24.98 billion.
Strategically, Freeport-McMoRan Inc. is positioned to benefit from domestic policy, being called 'America's Copper Champion' amid a 50% tariff on copper imports that took effect on August 1, 2025. The company is actively pursuing growth through initiatives like scaling its leach opportunity, targeting an 800 million pounds per year run rate for incremental copper production. Despite the recent operational challenges, Freeport-McMoRan Inc. maintains a strong balance sheet, ending Q3 2025 with $4.3 billion in cash.
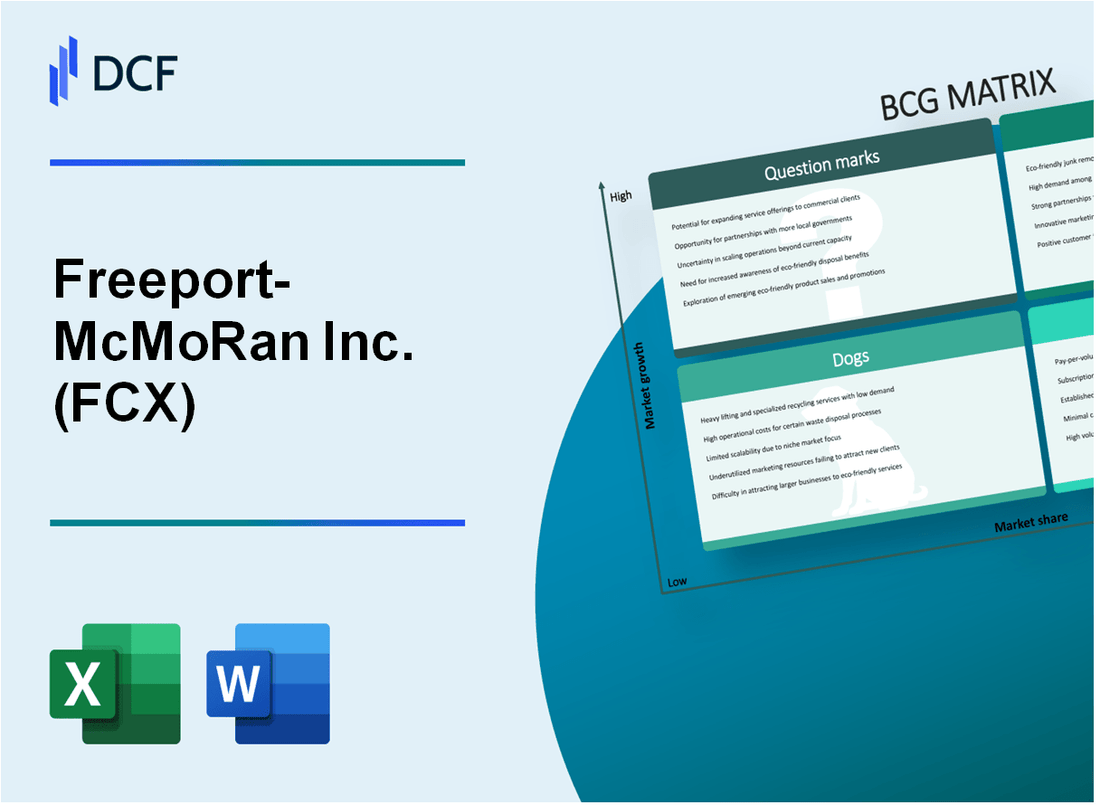
Freeport-McMoRan Inc. (FCX) - BCG Matrix: Stars
You're looking at the business units that are driving the growth story for Freeport-McMoRan Inc. (FCX) right now-the Stars. These are the segments where high market share meets a high-growth market, meaning they need significant investment to maintain their lead, but they are the future Cash Cows.
North America Copper is definitely a Star, largely because of the favorable domestic market dynamics Freeport-McMoRan is capturing. The company is strategically positioned as America's Copper Champion, with its U.S. operations accounting for approximately one-third of its total copper production, averaging about 1.4 billion pounds a year. The key driver here is the market premium following the U.S. tariff action. In Q2 2025, COMEX copper prices averaged $4.72 per pound, while the London Metal Exchange (LME) averaged $4.32 per pound. This resulted in a 28% premium for COMEX over LME in Q2 2025. This premium translates to an approximate $1.7 billion annual financial benefit on Freeport-McMoRan's U.S. sales alone.
The Copper Leach Innovation initiative is a high-growth, low-risk technological play that is consuming cash but promises significant future returns. This effort targets copper in stockpiles previously considered unrecoverable. Freeport-McMoRan is targeting a run rate of 300 million pounds per annum from this initiative by the end of 2025. This is a substantial step up from the 214 million pounds of incremental production achieved in 2024. The cost structure is compelling; the copper extracted through this method currently costs less than $1/lb.
The overall Global Copper Production profile positions Freeport-McMoRan as a leader in a market expected to grow. While Q2 2025 production was 436,809 tonnes, the full-year 2025 guidance for copper sales remains strong at 3.95 billion pounds. The broader market context suggests high growth, with the market size for top players projected to reach $24 billion by 2025, up from $21.2 billion in 2019. Freeport-McMoRan's market share was projected to rise from 33.7% in 2019 to over 50% by 2025, reflecting its high relative market share ambition.
The Bagdad 2X Expansion is a major, capital-intensive growth project in Arizona that exemplifies the investment needed for a Star. The project is designed to more than double the concentrator capacity, aiming for an expansion of ~90 - 105k tonnes of ore per day (t/d). This could increase production by approximately 200-250 million pounds per year. The estimated capital cost is approximately $3.5 billion. For 2025, the company has allocated about $200 million in CapEx specifically to this project. An investment decision is expected by year-end 2025, with a potential start-up in 2029.
Here's a look at how the 2025 capital allocation supports these growth drivers:
| Category | 2025 Projected Value | Notes |
|---|---|---|
| Consolidated Capital Expenditures (Total) | $4.3 billion to $4.4 billion | Excluding Indonesia downstream projects |
| Allocation to Major Projects (Total) | $2.8 billion | Covers Bagdad and other key growth initiatives |
| Bagdad 2X Expansion Specific CapEx (Estimate) | $200 million | 2025e, net of avoided coal cost |
| Bagdad Expansion Incremental Production | 200-250 million pounds per year | Expected upon completion |
The investment in these Stars is strategic, focusing on maintaining leadership in high-demand areas:
- North America Copper benefits from a 28% COMEX price premium over LME in Q2 2025.
- Copper Leach Innovation targets 300 million pounds annual run rate by end of 2025.
- Bagdad 2X Expansion requires copper prices averaging at least $4 a pound for ROI.
- Full-year 2025 projected copper sales guidance is 3.95 billion pounds.
The cash consumption is evident in the required capital outlay. Freeport-McMoRan expects consolidated capital expenditures for 2025 to be around $4.4 billion (excluding downstream projects), with $2.8 billion specifically earmarked for major projects. This level of investment is what keeps these high-growth assets positioned to become the next generation of Cash Cows once market growth normalizes.
Freeport-McMoRan Inc. (FCX) - BCG Matrix: Cash Cows
Cash Cows for Freeport-McMoRan Inc. are those business units or mature assets that command high market share, generate significant, stable cash flow, and require relatively low investment to maintain their productivity. These operations are the financial backbone, funding growth initiatives elsewhere in the portfolio.
The following table summarizes key 2025 financial and operational data points relevant to these established assets, based on Q3 2025 reporting and updated full-year guidance.
| Metric | Value as of Q3 2025 / FY 2025 Guidance | Source Context |
|---|---|---|
| Projected Full Year 2025 Operating Cash Flow | Approximately $5.5 billion | Management guidance for FY 2025 OCF |
| Cash and Cash Equivalents (End Q3 2025) | $4.3 billion | Balance sheet position |
| Net Debt (Excluding PTFI Downstream Debt) | Approximately $1.7 billion | Balance sheet resilience metric |
| Consolidated Unit Net Cash Cost (FY 2025 Avg.) | $1.68 per pound | Full-year cost expectation |
| Projected FY 2025 Copper Sales Volume | 3.5 billion pounds | Full-year sales guidance |
Grasberg Gold Production
The Grasberg minerals district in Indonesia, where Freeport-McMoRan holds a 49% stake, is a massive, low-cost asset. Despite the tragic mud rush incident on September 8, 2025, which suspended operations, the underlying cost structure remains highly favorable when operating. The unit net cash credits for PTFI (PT Freeport Indonesia) are projected at $0.53 per pound of copper. This credit effectively means the copper production cost is significantly negative, making it a powerful cash generator when running smoothly. The company is executing a phased restart, with 2026 production projected to align with 2025 estimates, approximating 1.0 billion pounds of copper and 900,000 ounces of gold.
The operational disruption has immediate financial consequences, though, as Q4 2025 copper sales are forecasted at only 635 million pounds, explicitly assuming minimal contribution from Indonesia during the restart period.
Established South America Copper (e.g., Cerro Verde)
Assets like the Cerro Verde mine in Peru, where Freeport-McMoRan holds a 55% ownership stake, represent mature, high-share operations. These assets are crucial for providing the stable operating cash flow that defines a Cash Cow. The outline suggests these established South American operations are projected to contribute around $5.5 billion in stable operating cash flow for the full year 2025. This figure aligns with the company's overall guidance for full-year operating cash flow, underscoring the importance of these steady producers.
Morenci Copper Mine (Arizona)
The Morenci mine in Arizona, a flagship U.S. asset where Freeport-McMoRan has a 72% interest, is a consistent, high-volume producer with a long reserve life. This domestic operation generates reliable cash flow, which is vital for U.S.-dollar-denominated stability. The company noted that average unit net cash costs for U.S. copper mines declined in Q3 2025 due to better productivity and ore grades. This focus on efficiency in the U.S. portfolio helps maximize the cash extraction from these mature, high-market-share assets.
You can see the operational focus in the full-year cost guidance:
- Full-year 2025 consolidated unit net cash cost is expected to average $1.68 per pound.
- Q3 2025 unit net cash cost was significantly lower at $1.40 per pound.
Strong Balance Sheet
The cash generated by these Cash Cows directly supports the company's financial resilience. As of the end of Q3 2025, Freeport-McMoRan ended the quarter with $4.3 billion in cash and cash equivalents. The company maintains a low net debt position, specifically reported as only $1.7 billion when excluding debt related to the PTFI downstream project. This liquidity position, supported by the reliable cash generation, provides flexibility to manage the Grasberg restart costs while maintaining shareholder returns, including a dividend of $0.15 per share declared for Q3 2025.
The company's ability to generate cash, even with the Grasberg disruption, is evident in the Q3 2025 operating cash flow of $1.66 billion. Finance: draft 13-week cash view by Friday.
Freeport-McMoRan Inc. (FCX) - BCG Matrix: Dogs
DOGS represent business units or products operating in low market growth areas while holding a low relative market share. These units typically neither consume nor generate significant cash flow, often breaking even, but they tie up capital that could be better deployed elsewhere. For Freeport-McMoRan Inc., the Dog quadrant is characterized by specific, non-core or mature operations.
The Molybdenum Business is a clear candidate for this quadrant due to its lower revenue contribution compared to copper and gold, despite its operational stability. In the second quarter of 2025, molybdenum production and sales both totaled 22 million pounds. The average realized price for this metal during Q2 2025 was $21.10 per pound. This segment contributed approximately $180 million to Freeport-McMoRan Inc.'s revenue stream for the quarter. The unit cash cost for this business in Q2 2025 was reported at $14.20 per pound.
Here is a snapshot of the Molybdenum Business performance metrics for Q2 2025:
| Metric | Value (Q2 2025) |
| Production/Sales Volume | 22 million pounds |
| Unit Cash Cost | $14.20 per pound |
| Average Realized Price | $21.10 per pound |
| Revenue Contribution (Approx.) | $180 million |
The full-year 2025 sales guidance for molybdenum remains projected at 82 million pounds.
Certain Legacy Assets fall into the Dog category because they represent older, higher-cost mining operations that require ongoing maintenance capital expenditure but offer minimal prospects for significant future growth or strategic advantage in Freeport-McMoRan Inc.'s core copper strategy. These assets are generally those outside the major growth pipelines like the Indonesian expansion or the defined US sulfide expansions. While specific unit costs for all legacy assets are not aggregated as a single 'Dog' metric, the overall strategy points toward minimizing focus on these non-core, higher-cost producers.
The portfolio includes assets such as:
- Mines in Arizona like Safford and Miami.
- Mines in New Mexico such as Chino and Tyrone.
The Oil and Gas Assets segment represents a historical divestiture effort, aligning perfectly with the Dog strategy of avoidance and minimization. Freeport-McMoRan Inc. has actively worked to exit this non-core segment to focus capital and management attention back onto mining. Historically, before the major divestitures, oil and gas accounted for 20% of the company's revenue in 2014, but this share had shrunk dramatically to just 2% of total revenue by the first quarter of 2016. The strategic move was to sell these assets, even at significant discounts from acquisition cost, to reduce debt and focus on copper, suggesting any remaining minor operations have a low relative share and limited strategic focus as of 2025.
Freeport-McMoRan Inc. (FCX) - BCG Matrix: Question Marks
You're looking at the high-growth, low-market-share segment of Freeport-McMoRan Inc.'s portfolio, the Question Marks. These are the units that demand significant cash to build market position but haven't yet delivered substantial returns. They are the future Stars, but only if we invest correctly now, or they risk becoming Dogs.
Grasberg Copper Production (Near-Term)
The Grasberg Block Cave (GBC) operation in Indonesia, a key driver of Freeport-McMoRan's copper output, currently fits this quadrant due to a severe, unexpected event. The copper market is high-growth, but GBC's relative share has been severely impaired by a September 8, 2025, mud rush incident, which involved approximately 800,000 tonnes of wet material entering the mine.
This event forced a complete suspension of operations on September 9, 2025, and led to a declaration of force majeure on commercial contracts. As of September 20, 2025, the incident resulted in two confirmed fatalities, with five workers still missing, though another report indicates seven fatalities. Because Indonesian operations typically contribute about 35% of Freeport-McMoRan's global copper output, the impact is material. The company anticipates a 35% decrease in 2026 production compared to prior estimates, with a phased restart of the GBC anticipated beginning in the second-quarter 2026 and full recovery targeted for 2027.
Here's a quick look at the immediate operational status:
- Incident Date: September 8, 2025.
- Material Inflow: Approximately 800,000 tonnes.
- Expected Production Impact Duration: Into 2026.
- GBC Restart Target: Phased start in Q2 2026.
Q4 2025 Indonesia Operations
The aftermath of the GBC incident directly impacts the immediate financial metrics for the end of the fiscal year. Due to the operational halt, Freeport expects minimal fourth-quarter 2025 contributions from its Indonesian mining operations. This lack of expected output, coupled with the costs associated with recovery and investigation, drives up the per-pound cost metric significantly for the quarter.
The guidance provided shows a clear spike in unit costs for the final quarter:
| Metric | 2025 Full Year Projection (Average) | Q4 2025 Projection |
| Unit Net Cash Cost (Copper, after by-product credits) | $1.68 per pound | $2.47 per pound |
This projected $2.47 per pound cost for Q4 2025 is substantially higher than the expected annual average, illustrating the cash consumption of this low-share, high-disruption unit.
El Abra Sulfide Expansion (Chile)
The El Abra Sulfide Expansion in Chile represents a massive potential investment that, if successful, could become a Star. It is currently a Question Mark because it requires a massive, uncommitted investment while still in the pre-feasibility stage. Freeport-McMoRan, which holds a 51% stake in the operation, plans to invest approximately $7.5 billion in this project.
The potential upside is significant, aiming to add an annual copper production of approximately 340,000 tons. The project is supported by approximately 20Blb of recoverable copper resources. However, the path forward is contingent on further study completion and permitting. The pre-feasibility studies are expected to conclude in 2026, with the permit application and Environmental Impact Statement (EIS) preparation expected to be completed in the first quarter of 2026.
Key project characteristics:
- Investment Size: $7.5 billion.
- Potential Annual Copper Addition: Approximately 340,000 tons.
- Ownership: Freeport holds 51%.
- Pre-Feasibility Completion: Expected in 2026.
Kucing Liar Development
The Kucing Liar underground ore body development in the Grasberg district is a long-term play, fitting the Question Mark profile because it is in a high-growth market (copper/gold) but has no current market share, with production not targeted until later. Commercial production is targeted to start by 2030. The pre-production development phase began in 2022 and is expected to last for about 10 years.
This development requires substantial upfront cash consumption before any revenue generation. Capital investment is estimated to average around US$400 million per year during this pre-production period, with total estimated capital investment over the next seven to eight years reaching $4 billion. If successful, the project is projected to yield over 7 billion pounds of copper and 6 million ounces of gold between 2029 and the end of 2041.
Here are the investment and timeline figures for this future asset:
| Metric | Value | Timeline/Period |
| Production Start Target | Commercial Production | 2030 |
| Pre-Production Capex (Annual Average) | $400 million USD | During the 10-year development phase |
| Total Estimated Capex | $4 billion USD | Over the next seven to eight years |
| Projected Copper Production | Over 7 billion pounds | Between 2029 and end of 2041 |
The decision for Freeport-McMoRan here is whether to continue funding this development, which consumes cash now, or divest, betting on its potential to become a major Star asset later this decade.
Disclaimer
All information, articles, and product details provided on this website are for general informational and educational purposes only. We do not claim any ownership over, nor do we intend to infringe upon, any trademarks, copyrights, logos, brand names, or other intellectual property mentioned or depicted on this site. Such intellectual property remains the property of its respective owners, and any references here are made solely for identification or informational purposes, without implying any affiliation, endorsement, or partnership.
We make no representations or warranties, express or implied, regarding the accuracy, completeness, or suitability of any content or products presented. Nothing on this website should be construed as legal, tax, investment, financial, medical, or other professional advice. In addition, no part of this site—including articles or product references—constitutes a solicitation, recommendation, endorsement, advertisement, or offer to buy or sell any securities, franchises, or other financial instruments, particularly in jurisdictions where such activity would be unlawful.
All content is of a general nature and may not address the specific circumstances of any individual or entity. It is not a substitute for professional advice or services. Any actions you take based on the information provided here are strictly at your own risk. You accept full responsibility for any decisions or outcomes arising from your use of this website and agree to release us from any liability in connection with your use of, or reliance upon, the content or products found herein.