
|
Fennec Pharmaceuticals Inc. (FENC): ANSOFF MATRIX [Dec-2025 Updated] |
Fully Editable: Tailor To Your Needs In Excel Or Sheets
Professional Design: Trusted, Industry-Standard Templates
Investor-Approved Valuation Models
MAC/PC Compatible, Fully Unlocked
No Expertise Is Needed; Easy To Follow
Fennec Pharmaceuticals Inc. (FENC) Bundle
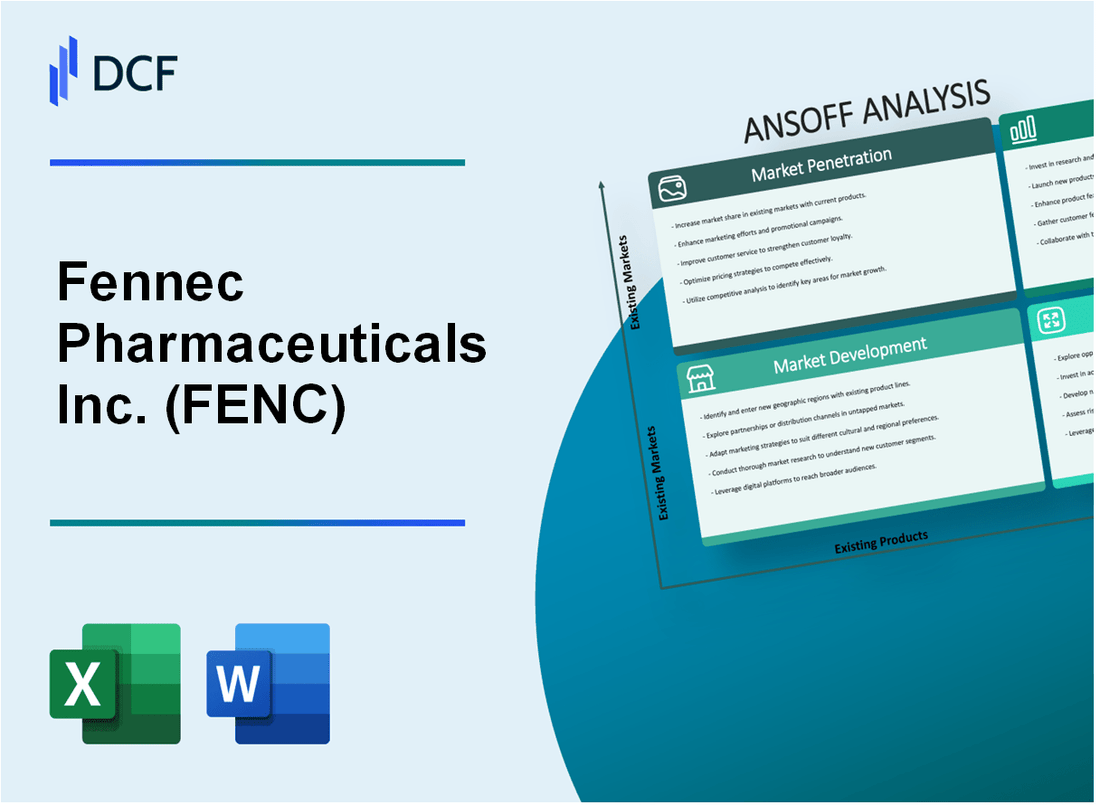
You're looking for a clear strategic roadmap for Fennec Pharmaceuticals Inc. (FENC), and after years mapping out growth for firms like BlackRock, I can tell you the Ansoff Matrix cuts through the noise to show exactly where the near-term risks and opportunities lie. We've translated the four growth quadrants-from deepening sales in current pediatric oncology centers to exploring entirely new frontiers like veterinary pharma or digital health-into concrete, actionable steps for Fennec Pharmaceuticals Inc. (FENC). This isn't just theory; it's a direct view of how the company can balance incremental gains with aggressive expansion. Dive in below to see the specific plays we see as most critical for the next phase.
Fennec Pharmaceuticals Inc. (FENC) - Ansoff Matrix: Market Penetration
You're looking at the core of Fennec Pharmaceuticals Inc. (FENC)'s current strategy: driving deeper adoption of existing products, primarily PEDMARK®, within established markets. This is about maximizing sales from the customer segments Fennec is already targeting.
The results from the first three quarters of 2025 show clear upward momentum in sales volume, which is the direct output of market penetration efforts. Net Product Sales for the third quarter of 2025 hit a record of approximately $12.5 million, representing a year-over-year increase of approximately 79% compared to the third quarter of 2024's $7.0 million. This performance indicates that the strategy to increase adoption across key accounts is gaining traction.
The table below details the quarterly net product sales for the product, showing the progression through the first nine months of 2025 against the prior year:
| Period Ending | 2025 Net Product Sales | 2024 Net Product Sales |
| September 30, 2025 (Q3) | $12.5 million | $7.0 million |
| June 30, 2025 (Q2) | $9.7 million | $7.3 million |
| March 31, 2025 (Q1) | $8.8 million | $7.4 million |
The cumulative effect is significant; net product sales for the first nine months of 2025 surpassed the total net product sales for the entire fiscal year of 2024. The trailing twelve-month revenue as of September 30, 2025, stood at $38.79 million.
Regarding the sales force focus on high-volume pediatric oncology centers, the Q2 2025 update noted double-digit growth in new accounts, with increased adoption specifically in large community practices and academic centers. Fennec Pharmaceuticals Inc. (FENC) has a total of 32 employees, suggesting a highly focused commercial team supporting this targeted execution. The Selling and Marketing Expenses reflect this focus, coming in at $4.4 million for the second quarter of 2025, down from $4.6 million in the second quarter of 2024. For the first quarter of 2025, Selling and Marketing Expenses were $2.9 million, a decrease from $5.2 million in the first quarter of 2024.
The strategy to negotiate favorable formulary placement with major US Group Purchasing Organizations (GPOs) is implied by the reported growth in account retention and new account acquisition. While specific GPO contract terms or numbers of agreements are not public, the commercial availability of PEDMARQSI® in the United Kingdom and Germany represents international market penetration via a licensing agreement with Norgine Pharmaceuticals Ltd.
For the direct-to-patient awareness campaign to drive demand, the company highlighted enhanced patient support program offerings and increased awareness of the importance of preventing cisplatin-induced ototoxicity (CIO) as drivers for the sales acceleration. The revamped Fennec HEARS™ patient support program launched in Q1 2025 included expanded payer reimbursement support and streamlined access to home nursing resources.
The initiative to offer tiered pricing models to increase product accessibility in underserved US regions is supported by the reported financial stability, which allows for such flexibility. Cash and cash equivalents were $18.7 million as of June 30, 2025, rising to $21.9 million as of September 30, 2025, and the company reported its first positive cash flow from operations in Q3 2025.
Expansion of physician education programs on product benefits and administration protocols is reflected in the reported success in driving adoption across academic and community providers. The company noted that its segmentation model and data-driven target lists enhanced field execution, yielding measurable impact in the first quarter of 2025.
Fennec Pharmaceuticals Inc. (FENC) - Ansoff Matrix: Market Development
You're looking at how Fennec Pharmaceuticals Inc. is taking its existing product, PEDMARK®/PEDMARQSI®, into new geographic territories and patient segments. This is about expanding the market for what you already have approved, which is generally the lower-risk path in the Ansoff Matrix.
The European commercialization efforts with Norgine are clearly underway, which is a big step for market development outside the U.S. You can see the tangible progress in the table below:
| Market/Region | Product Name | Key Milestone Date | Status/Action |
| England and Wales | PEDMARQSI® | First Quarter of 2025 | Commercial Launch |
| Germany | PEDMARQSI® | February 2025 | Commercial Launch |
| Scotland | PEDMARQSI® | May 2025 | Scottish Medicines Consortium (SMC) Acceptance |
These European launches are part of the exclusive licensing agreement with Norgine, which covers Europe, U.K., Australia, and New Zealand. The company noted that the decrease in Selling and Marketing Expenses year-over-year in Q1 2025 was primarily due to the elimination of expenses associated with European pre-commercialization which occurred in 2024 prior to the Norgine partnership. The momentum is translating to the top line; Fennec Pharmaceuticals Inc. reported total net revenues of $8.8 Million in Q1 2025, growing to $9.7 Million in Q2 2025, which matched the highest quarterly net product sales in the company's history.
Regarding Japan, the strategy is still in the clinical data gathering phase for market entry. You should be watching for the results from the investigator-initiated clinical trial STS-J01, which are expected in the second half of 2025. Following those results, Fennec Pharmaceuticals Inc. plans the evaluation of both registration and partnering or licensing opportunities there.
For new patient populations, Fennec Pharmaceuticals Inc. is actively targeting the Adolescent and Young Adult (AYA) segment within the U.S. market. This is a clear market development move away from just the initial pediatric focus. You saw this reflected in the U.S. commercial performance, as growth across PEDMARK accounts included new accounts in the AYA population. Specifically, PEDMARK® was added to a large national oncology group's formulary for patients under 40. The company holds patents providing protection for PEDMARK until 2039 in both the U.S. and internationally.
The following points from the strategy outline are areas where the latest reports do not provide specific, verifiable 2025 financial or statistical data, but represent the stated strategic intent:
- Establish strategic distribution partnerships in high-growth emerging markets like Brazil and India.
- Target new patient populations by pursuing a label expansion for an adult indication.
- Leverage existing clinical data to support product adoption in new therapeutic areas.
- File for World Health Organization (WHO) prequalification to access global procurement tenders.
Financially, Fennec Pharmaceuticals Inc. is focused on achieving cash flow breakeven with consistent quarterly revenue of $8.5 to $9 million. As of June 30, 2025, the cash and cash equivalents position stood at $18.7 million.
Fennec Pharmaceuticals Inc. (FENC) - Ansoff Matrix: Product Development
You're looking at Fennec Pharmaceuticals Inc. (FENC) and trying to map out where the next wave of value creation will come from beyond the current PEDMARK® commercial success. Product Development, in this context, means extending the life and utility of your core asset and building out the pipeline, which is where the real long-term upside lives. Here's the quick math on where the company is investing its capital and what clinical milestones are on the immediate horizon for late 2025.
The foundation for any new development is the current commercial engine. Fennec Pharmaceuticals Inc. delivered record net product sales of $12.5 million in the third quarter of 2025, which was a 79% year-over-year increase. This momentum is critical because it funded the ongoing work. The company achieved its first positive cash flow from operations in Q3 2025, and the cash position grew to $22 million as of September 30, 2025. This financial discipline allows for continued investment in the pipeline, even as the company maintained 2025 operating expenses at $33 million.
Regarding pipeline advancement, which aligns with initiating clinical trials for new indications or therapies, Fennec Pharmaceuticals Inc. has two key clinical efforts in focus right now, which serve as the proxy for R&D capital deployment:
- The investigator-initiated clinical trial, STS-J01, conducted in Japan, is expected to report preliminary results in the fourth quarter of 2025.
- The PEDM-11 clinical trial is on track, with initial data anticipated in the latter half of 2025.
To be fair, the company also has data from earlier work on the ADH-1 compound, an anti-N-cadherin agent, where 30 patients were enrolled across dose ranges up to 2400 mg/m(2) in a Phase 1/2 study. This shows a willingness to explore novel mechanisms outside of ototoxicity prevention.
The value of the core product, PEDMARK®, is protected by significant exclusivity periods, which justifies the investment in these development activities. Fennec Pharmaceuticals Inc. has patents providing protection for PEDMARK until 2039 in both the U.S. and internationally. Furthermore, the European authorization for PEDMARQSI includes eight years plus two years of data and market protection.
While the outline suggests specific actions like acquiring a late-stage asset or licensing a novel delivery technology, the publicly available financial data for 2025 primarily reflects the commercial execution and the progress of the STS-J01 and PEDM-11 trials. The company's market capitalization was approximately $150 million as of November 2025, which frames the scale of potential future M&A or licensing investments.
Here is a snapshot of the recent commercial and financial performance that underpins the Product Development strategy:
| Metric | Q1 2025 Amount (in thousands) | Q2 2025 Amount (in thousands) | Q3 2025 Amount |
| Net Product Sales | $8,800 | $9,700 | $12.5 million |
| Cash & Equivalents (Period End) | $22,600 (Mar 31) | $18,700 (Jun 30) | $22 million (Sep 30) |
| Selling & Marketing Expenses | $2,900 | $4,400 | Data not explicitly available |
Finance: draft 13-week cash view by Friday.
Fennec Pharmaceuticals Inc. (FENC) - Ansoff Matrix: Diversification
You're looking at Fennec Pharmaceuticals Inc. (FENC) and mapping out where the next big jump in revenue might come from beyond just expanding PEDMARK® adoption. Before we look at new territory, consider the recent capital moves. Fennec Pharmaceuticals Inc. fully repurchased and redeemed its remaining senior secured floating rate convertible notes held by Petrichor on November 17, 2025, paying a total redemption price of $21,729,455.30. That transaction eliminated all payment obligations under those notes. Just a day later, on November 18, 2025, the company closed a transaction that brought in $5.025 million in funding.
As of the third quarter ended September 30, 2025, Fennec Pharmaceuticals Inc. posted record net product sales of $12.5 million, marking a 79% year-over-year increase. The company achieved its first positive cash flow from operations in that quarter, with cash and cash equivalents rising to $21.9 million as of September 30, 2025. The market capitalization for Fennec Pharmaceuticals Inc. stood at $279.72 million as of November 28, 2025. The trailing twelve months revenue ending September 30, 2025, was $38.79 million.
To gauge the scale of Fennec Pharmaceuticals Inc. against these potential diversification vectors, here is a look at its current financial anchors:
| Metric | Value (2025 Data) |
| Market Capitalization | $279.72 million |
| TTM Revenue (ending Sep 30, 2025) | $38.79 million |
| Q3 2025 Net Product Sales | $12.5 million |
| Cash & Equivalents (Sep 30, 2025) | $21.9 million |
| Shares Outstanding | 34.15 million |
The proposed diversification strategies map to the following areas of potential expansion for Fennec Pharmaceuticals Inc.:
- Acquire a small medical device company focused on oncology support care.
- Establish a new division targeting rare disease therapeutics outside of oncology.
- Form a joint venture to develop a non-pharmaceutical digital health platform for patient monitoring.
- Enter the veterinary pharmaceutical market with a modified version of an existing compound.
- Purchase a Contract Manufacturing Organization (CMO) to secure supply chain and offer third-party services.
For the first point, an acquisition of a small medical device company would need to be evaluated against the current cash position of $21.9 million as of September 30, 2025, especially after the recent debt retirement. The company is currently valued by the market at approximately $279.72 million.
Establishing a new division for rare disease therapeutics would require funding R&D or licensing costs, which is a significant step given the company's Q3 2025 operating loss was $0.19 million. The projected full-year 2025 revenue estimate stands at $47.94 million.
A joint venture for a digital health platform would be an investment outside the core pharmaceutical revenue stream, which saw Q3 2025 sales of $12.5 million. The company reported 112 employees in one data point, suggesting a smaller operational footprint that would need to scale for a digital platform division.
Entering the veterinary pharmaceutical market would involve adapting an existing compound, perhaps leveraging the intellectual property that provides protection for PEDMARK® until 2039. The Q2 2025 net product sales were $9.7 million, providing a baseline for product revenue scale.
Purchasing a Contract Manufacturing Organization (CMO) would be a vertical integration play. The company's Selling and Marketing Expenses were $5.2 million in Q3 2025, which represents a significant operational spend that a CMO purchase could potentially offset or convert to a capital asset.
Disclaimer
All information, articles, and product details provided on this website are for general informational and educational purposes only. We do not claim any ownership over, nor do we intend to infringe upon, any trademarks, copyrights, logos, brand names, or other intellectual property mentioned or depicted on this site. Such intellectual property remains the property of its respective owners, and any references here are made solely for identification or informational purposes, without implying any affiliation, endorsement, or partnership.
We make no representations or warranties, express or implied, regarding the accuracy, completeness, or suitability of any content or products presented. Nothing on this website should be construed as legal, tax, investment, financial, medical, or other professional advice. In addition, no part of this site—including articles or product references—constitutes a solicitation, recommendation, endorsement, advertisement, or offer to buy or sell any securities, franchises, or other financial instruments, particularly in jurisdictions where such activity would be unlawful.
All content is of a general nature and may not address the specific circumstances of any individual or entity. It is not a substitute for professional advice or services. Any actions you take based on the information provided here are strictly at your own risk. You accept full responsibility for any decisions or outcomes arising from your use of this website and agree to release us from any liability in connection with your use of, or reliance upon, the content or products found herein.