
|
Finolex Industries Limited (FINPIPE.NS) DCF Valuation |
Fully Editable: Tailor To Your Needs In Excel Or Sheets
Professional Design: Trusted, Industry-Standard Templates
Investor-Approved Valuation Models
MAC/PC Compatible, Fully Unlocked
No Expertise Is Needed; Easy To Follow
Finolex Industries Limited (FINPIPE.NS) Bundle
Enhance your investment strategies with the (FINPIPENS) DCF Calculator! Explore detailed Finolex Industries Limited financials, adjust growth projections and expenses, and instantly observe the effects of these changes on the intrinsic value of (FINPIPENS).
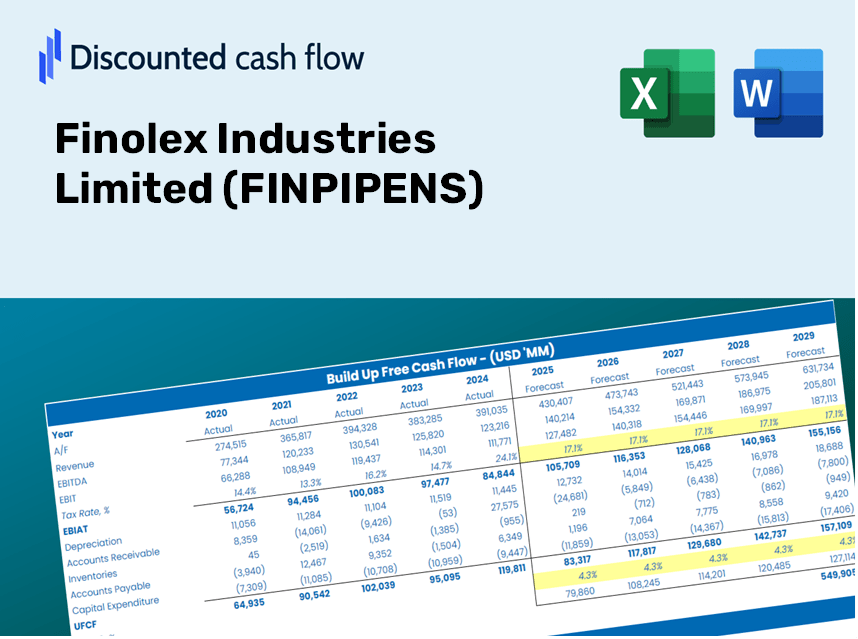
Discounted Cash Flow (DCF) - (USD MM)
| Year | AY1 2021 |
AY2 2022 |
AY3 2023 |
AY4 2024 |
AY5 2025 |
FY1 2026 |
FY2 2027 |
FY3 2028 |
FY4 2029 |
FY5 2030 |
|---|---|---|---|---|---|---|---|---|---|---|
| Revenue | 34,375.5 | 46,473.2 | 43,970.5 | 43,174.3 | 41,419.7 | 43,897.9 | 46,524.4 | 49,308.1 | 52,258.3 | 55,385.0 |
| Revenue Growth, % | 0 | 35.19 | -5.39 | -1.81 | -4.06 | 5.98 | 5.98 | 5.98 | 5.98 | 5.98 |
| EBITDA | 10,630.1 | 14,681.6 | 3,993.7 | 7,562.4 | 4,758.0 | 8,832.3 | 9,360.8 | 9,920.9 | 10,514.5 | 11,143.6 |
| EBITDA, % | 30.92 | 31.59 | 9.08 | 17.52 | 11.49 | 20.12 | 20.12 | 20.12 | 20.12 | 20.12 |
| Depreciation | 777.2 | 834.0 | 892.0 | 1,160.2 | 1,067.1 | 996.3 | 1,055.9 | 1,119.1 | 1,186.0 | 1,257.0 |
| Depreciation, % | 2.26 | 1.79 | 2.03 | 2.69 | 2.58 | 2.27 | 2.27 | 2.27 | 2.27 | 2.27 |
| EBIT | 9,852.9 | 13,847.6 | 3,101.7 | 6,402.2 | 3,690.9 | 7,836.1 | 8,304.9 | 8,801.8 | 9,328.4 | 9,886.6 |
| EBIT, % | 28.66 | 29.8 | 7.05 | 14.83 | 8.91 | 17.85 | 17.85 | 17.85 | 17.85 | 17.85 |
| Total Cash | 8,149.6 | 16,033.7 | 17,999.7 | 19,075.6 | 22,694.1 | 17,393.9 | 18,434.6 | 19,537.6 | 20,706.6 | 21,945.5 |
| Total Cash, percent | .0 | .0 | .0 | .0 | .0 | .0 | .0 | .0 | .0 | .0 |
| Account Receivables | 1,592.7 | 3,595.4 | 3,291.5 | 4,756.7 | 3,925.2 | 3,542.5 | 3,754.5 | 3,979.1 | 4,217.2 | 4,469.5 |
| Account Receivables, % | 4.63 | 7.74 | 7.49 | 11.02 | 9.48 | 8.07 | 8.07 | 8.07 | 8.07 | 8.07 |
| Inventories | 9,188.2 | 10,154.7 | 6,731.5 | 7,280.3 | 7,824.2 | 8,748.1 | 9,271.5 | 9,826.2 | 10,414.2 | 11,037.3 |
| Inventories, % | 26.73 | 21.85 | 15.31 | 16.86 | 18.89 | 19.93 | 19.93 | 19.93 | 19.93 | 19.93 |
| Accounts Payable | 4,357.9 | 4,630.8 | 2,893.0 | 2,886.4 | 4,441.6 | 4,093.9 | 4,338.9 | 4,598.5 | 4,873.6 | 5,165.2 |
| Accounts Payable, % | 12.68 | 9.96 | 6.58 | 6.69 | 10.72 | 9.33 | 9.33 | 9.33 | 9.33 | 9.33 |
| Capital Expenditure | -649.1 | -844.1 | -1,687.4 | -863.5 | -1,155.0 | -1,082.6 | -1,147.4 | -1,216.0 | -1,288.8 | -1,365.9 |
| Capital Expenditure, % | -1.89 | -1.82 | -3.84 | -2 | -2.79 | -2.47 | -2.47 | -2.47 | -2.47 | -2.47 |
| Tax Rate, % | 23.31 | 23.31 | 23.31 | 23.31 | 23.31 | 23.31 | 23.31 | 23.31 | 23.31 | 23.31 |
| EBITAT | 7,327.6 | 10,526.3 | 2,420.2 | 4,660.7 | 2,830.4 | 5,922.5 | 6,276.9 | 6,652.4 | 7,050.4 | 7,472.3 |
| Depreciation | ||||||||||
| Changes in Account Receivables | ||||||||||
| Changes in Inventories | ||||||||||
| Changes in Accounts Payable | ||||||||||
| Capital Expenditure | ||||||||||
| UFCF | 1,032.7 | 7,819.9 | 3,614.1 | 2,936.8 | 4,585.3 | 4,947.3 | 5,695.0 | 6,035.7 | 6,396.8 | 6,779.6 |
| WACC, % | 6.19 | 6.19 | 6.2 | 6.18 | 6.19 | 6.19 | 6.19 | 6.19 | 6.19 | 6.19 |
| PV UFCF | ||||||||||
| SUM PV UFCF | 24,801.4 | |||||||||
| Long Term Growth Rate, % | 4.00 | |||||||||
| Free cash flow (T + 1) | 7,051 | |||||||||
| Terminal Value | 321,947 | |||||||||
| Present Terminal Value | 238,433 | |||||||||
| Enterprise Value | 263,234 | |||||||||
| Net Debt | 1,114 | |||||||||
| Equity Value | 262,120 | |||||||||
| Diluted Shares Outstanding, MM | 618 | |||||||||
| Equity Value Per Share | 423.96 |
What You Will Receive
- Authentic FINPIPENS Financial Data: Pre-loaded with Finolex Industries Limited's historical and forecasted figures for accurate assessment.
- Completely Customizable Template: Easily adjust critical inputs such as revenue growth, WACC, and EBITDA percentage.
- Instant Calculations: Watch the intrinsic value of FINPIPENS update in real-time as you make adjustments.
- Expert Valuation Tool: Crafted for investors, analysts, and consultants aiming for precise DCF outcomes.
- User-Friendly Interface: Intuitive layout and straightforward instructions suitable for all skill levels.
Core Features
- Comprehensive DCF Calculator: Offers detailed unlevered and levered DCF valuation models tailored for Finolex Industries Limited (FINPIPENS).
- WACC Calculator: Includes a pre-configured Weighted Average Cost of Capital sheet with adjustable inputs to suit your analysis.
- Customizable Forecast Assumptions: Easily adjust growth rates, capital expenditures, and discount rates as needed.
- Integrated Financial Ratios: Evaluate profitability, leverage, and efficiency ratios specifically for Finolex Industries Limited (FINPIPENS).
- Interactive Dashboard and Charts: Visual representations highlight essential valuation metrics for straightforward analysis.
How It Works
- Step 1: Download the Excel file.
- Step 2: Examine Finolex Industries Limited’s (FINPIPENS) pre-filled financial data and forecasts.
- Step 3: Adjust key inputs such as revenue growth, WACC, and tax rates (highlighted cells).
- Step 4: Observe the DCF model refresh in real-time as you modify your assumptions.
- Step 5: Review the results and leverage the insights for your investment strategies.
Why Opt for the FINPIPENS Calculator?
- Time-Efficient: Skip the hassle of building a DCF model – our tool is instantly ready for use.
- Enhanced Precision: Access accurate financial data and formulas to minimize valuation errors.
- Fully Adaptable: Customize the model to suit your specific assumptions and forecasts.
- User-Friendly: Intuitive charts and outputs simplify result interpretation.
- Endorsed by Professionals: Crafted for experts who prioritize both accuracy and ease of use.
Who Can Benefit from Finolex Industries Limited (FINPIPENS)?
- Investors: Gain confidence in your financial decisions with our advanced valuation tools.
- Financial Analysts: Streamline your workflow with our customizable DCF model that’s ready to use.
- Consultants: Easily modify our template for effective client presentations and reports.
- Finance Enthusiasts: Enhance your knowledge of valuation methods through real-world applications.
- Educators and Students: Utilize this resource as a hands-on learning aid in finance courses.
Contents of the Template
- Operating and Balance Sheet Data: Pre-filled historical data and forecasts for Finolex Industries Limited (FINPIPENS), covering revenue, EBITDA, EBIT, and capital expenditures.
- WACC Calculation: A specific sheet dedicated to calculating the Weighted Average Cost of Capital (WACC), featuring parameters such as Beta, risk-free rate, and share price.
- DCF Valuation (Unlevered and Levered): Customizable Discounted Cash Flow models that demonstrate intrinsic value along with comprehensive calculations.
- Financial Statements: Pre-loaded annual and quarterly financial statements to facilitate thorough analysis.
- Key Ratios: Includes critical profitability, leverage, and efficiency ratios for Finolex Industries Limited (FINPIPENS).
- Dashboard and Charts: A visual summary of valuation outputs and assumptions for straightforward result analysis.
Disclaimer
All information, articles, and product details provided on this website are for general informational and educational purposes only. We do not claim any ownership over, nor do we intend to infringe upon, any trademarks, copyrights, logos, brand names, or other intellectual property mentioned or depicted on this site. Such intellectual property remains the property of its respective owners, and any references here are made solely for identification or informational purposes, without implying any affiliation, endorsement, or partnership.
We make no representations or warranties, express or implied, regarding the accuracy, completeness, or suitability of any content or products presented. Nothing on this website should be construed as legal, tax, investment, financial, medical, or other professional advice. In addition, no part of this site—including articles or product references—constitutes a solicitation, recommendation, endorsement, advertisement, or offer to buy or sell any securities, franchises, or other financial instruments, particularly in jurisdictions where such activity would be unlawful.
All content is of a general nature and may not address the specific circumstances of any individual or entity. It is not a substitute for professional advice or services. Any actions you take based on the information provided here are strictly at your own risk. You accept full responsibility for any decisions or outcomes arising from your use of this website and agree to release us from any liability in connection with your use of, or reliance upon, the content or products found herein.