
|
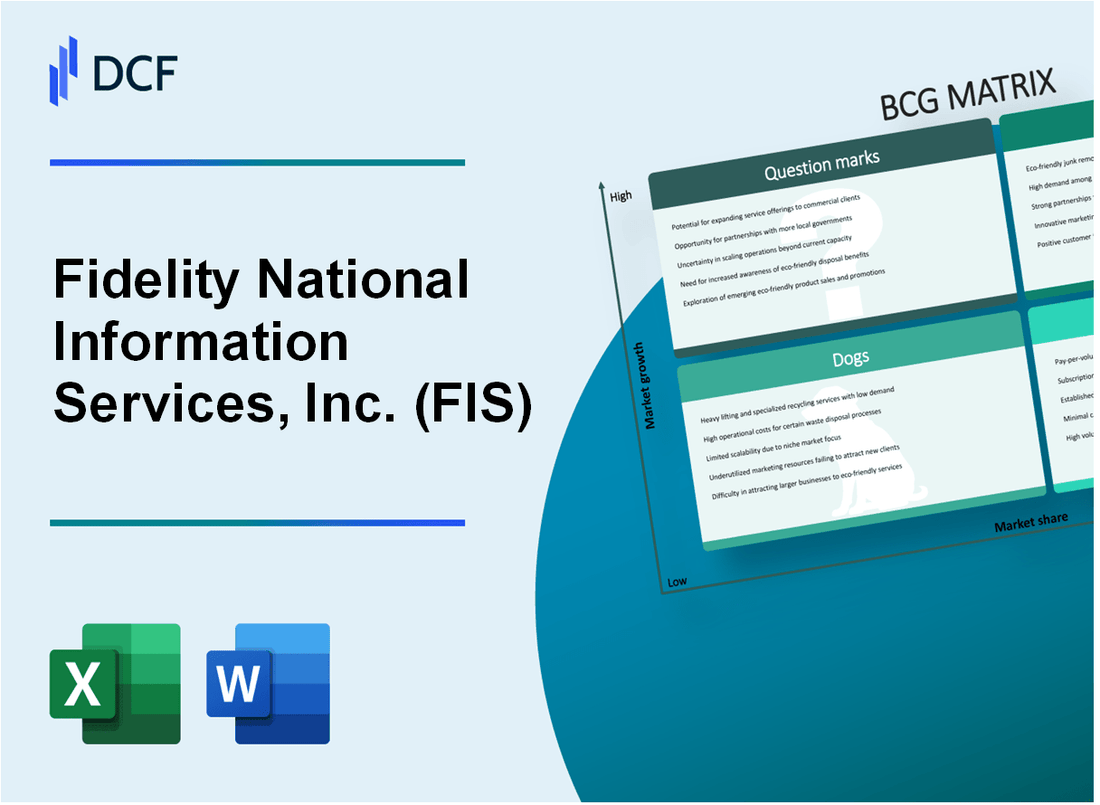
Fidelity National Information Services, Inc. (FIS): BCG Matrix [Dec-2025 Updated] |
Fully Editable: Tailor To Your Needs In Excel Or Sheets
Professional Design: Trusted, Industry-Standard Templates
Investor-Approved Valuation Models
MAC/PC Compatible, Fully Unlocked
No Expertise Is Needed; Easy To Follow
Fidelity National Information Services, Inc. (FIS) Bundle
You're looking for a clear-eyed view of where Fidelity National Information Services, Inc. (FIS) is putting its chips post-Worldpay, and the BCG Matrix is defintely the right tool for that. As of late 2025, we see high-margin Stars like Capital Market Solutions fueling growth, backed by Cash Cows whose recurring revenue base provides highly predictable cash flow, targeting over 85% conversion. But the strategy hinges on shedding Dogs-like the remaining Worldpay stake-while funding major Question Marks, such as the Issuer Solutions acquisition, which require significant capital to capture market share. Let's dive into the specifics of this portfolio to see where Fidelity National Information Services, Inc. (FIS) needs to place its next bet.
Background of Fidelity National Information Services, Inc. (FIS)
You're looking at Fidelity National Information Services, Inc. (FIS), which, as of late 2025, remains a major player in financial services technology. Honestly, they're focused on providing the tech backbone for how the world pays, banks, and invests. They've been busy streamlining their operations, which is key to understanding their current portfolio.
Looking at the numbers from the third quarter of 2025, Fidelity National Information Services, Inc. (FIS) posted GAAP revenue of approximately $2.7 billion, reflecting a 6% year-over-year increase on a GAAP basis. A big part of their story is stability; recurring revenue, which is the predictable, subscription-like income, grew by 6% in that same quarter. Management even raised the full-year 2025 outlook for adjusted revenue growth to land between 5.4% and 5.7%.
The business is primarily split into two major operational segments. First, you have Banking Solutions, which is the larger piece; in Q3 2025, this segment saw adjusted revenue growth of 6.2%, and its EBITDA margin expanded by 68 basis points to reach 45.8%. Then there's Capital Market Solutions, which is quite profitable, posting an adjusted revenue growth of 6.4% and an even stronger EBITDA margin of 50.5% after expanding by 60 basis points. To be fair, there's also the Corporate & Other segment, which is small and showed a GAAP revenue drop of 34% to just $40 million in Q3, with an adjusted EBITDA loss of $129 million.
Strategically, Fidelity National Information Services, Inc. (FIS) is actively reshaping its footprint. They've already completed the sale of a 55% stake in their Worldpay Merchant Solutions business back in 2024 and are planning to sell the remaining equity interest. On the acquisition front, they entered agreements to buy the Issuer Solutions business from Global Payments Inc. for a net purchase price of $12.0 billion, a deal they expect to close in the first half of 2026, which will add nearly 1 billion accounts to their platform. As of September 30, 2025, the total debt outstanding stood at $13.0 billion. Finance: draft 13-week cash view by Friday.
Fidelity National Information Services, Inc. (FIS) - BCG Matrix: Stars
You're analyzing Fidelity National Information Services, Inc. (FIS) portfolio, and the Stars quadrant is where the action is-high market share in markets that are still expanding rapidly. These units are leaders today, but they demand significant reinvestment to maintain that lead and eventually transition into Cash Cows when market growth slows. Honestly, keeping them fed with capital is the core of a growth strategy here.
The business units positioning as Stars for Fidelity National Information Services, Inc. (FIS) as of 2025 show strong top-line momentum coupled with best-in-class profitability in their respective segments. These are the growth engines that management is focused on funding.
Here's a look at the key metrics for these high-potential areas:
| Business Unit | Projected 2025 Revenue Growth | Q3 2025 Adjusted EBITDA Margin | Market Context/Recognition |
| Capital Market Solutions | 6.5% (as projected) | 50.5% | Industry-leading profitability in Q3 2025 |
| Digital Banking Solutions | Implied High Growth | 45.8% (Banking Solutions Segment) | Operating in a market with a projected 12% Compound Annual Growth Rate (CAGR) from 2025 to 2028 (as projected) |
The Capital Market Solutions segment, for instance, demonstrated exceptional operating leverage in the third quarter of 2025. Its Adjusted EBITDA margin hit 50.5%, which is a clear indicator of market leadership and pricing power, even as its revenue grew. For context, the overall company revenue growth projection for the full year 2025 was set between 5.4% and 5.7%, making the projected 6.5% for this segment look particularly strong.
The Digital Banking Solutions area is positioned to capture growth from a market that is still expanding significantly. We are looking at a projected Compound Annual Growth Rate (CAGR) of 12% between 2025 and 2028 for this space [cite: user-provided-data]. The broader Banking Solutions segment, which houses this, posted a strong Q3 2025 Adjusted EBITDA margin of 45.8%, showing that even the larger, more established part of the business is highly profitable.
Furthermore, Fidelity National Information Services, Inc. (FIS) has significant product validation in the core banking space, which feeds into the Digital Banking category. The Modern Banking Platform (MBP) is a key asset here:
- Recognized as a 'Visionary' by Gartner in the 2025 Magic Quadrant for Retail Core Banking Systems, North America.
- Noted for its strength in native composable and cloud architecture.
- Considered the fastest-growing core platform in the U.S. (as per your outline).
To maintain this Star status, Fidelity National Information Services, Inc. (FIS) must continue to pour resources into these areas. If the market growth for Digital Banking slows, and the MBP continues to capture share, you could see that 45.8% margin in Banking Solutions improve further as the unit matures into a Cash Cow. It's all about sustaining that market share now.
Fidelity National Information Services, Inc. (FIS) - BCG Matrix: Cash Cows
Cash Cows for Fidelity National Information Services, Inc. (FIS) are anchored by the established, high-market-share components of its Banking Solutions segment, which operate in a mature, yet essential, technology landscape.
Traditional Core Banking Platforms, such as HORIZON and Integrated Banking Solutions (IBS), maintain their market leadership position. These platforms were recognized in the "Leader" quadrant of the 2025 Gartner Magic Quadrant for Retail Core Banking Systems, North America, validating their strong ability to execute and deep functionality. This leadership translates directly into high customer retention and predictable revenue streams.
The Banking Solutions segment itself is showing stable, moderate growth, with the full-year 2025 outlook for revenue growth raised to a range of 4.9% to 5.3%. This segment is the engine for consistent cash generation, supported by a high base of recurring business.
The predictability of cash flow is exceptionally high; as of the second quarter of 2025, recurring revenue streams constituted approximately 81% of Fidelity National Information Services, Inc. (FIS)'s total revenue. This high percentage of recurring revenue means the cash flow is less susceptible to project-based volatility.
Fidelity National Information Services, Inc. (FIS) is actively optimizing this cash generation, increasing its target for Adjusted free cash flow conversion for the full year 2025 to greater than 85%. This focus on efficiency allows the business unit to generate substantial cash that can be deployed elsewhere in the enterprise.
Here are some key financial metrics associated with the cash-generating engine of Fidelity National Information Services, Inc. (FIS) as of late 2025:
| Metric | Value/Target | Context/Period |
| Adjusted Free Cash Flow Conversion Target | >85% | Full Year 2025 Outlook |
| Recurring Revenue as Percentage of Total Revenue | 81% | Q2 2025 |
| Banking Solutions Revenue Growth Outlook | 4.9% to 5.3% | Full Year 2025 Guidance |
| Q3 2025 Total Adjusted Revenue | $2.7 billion | Q3 2025 |
| Q2 2025 Banking Solutions Revenue Growth | 6% | Q2 2025 |
The strategy for these Cash Cows involves minimal growth investment, focusing instead on infrastructure support to drive efficiency and maximize the cash extraction rate. For example, in Q3 2025, Adjusted EBITDA margin for the combined segments was strong at 41.8%. Investments are directed toward maintaining the current high market share and ensuring the platforms remain compliant and efficient, rather than aggressive market expansion.
You should view these units as the primary source of capital for funding the company's Question Marks and maintaining Stars. The focus here is on operational excellence; for instance, Fidelity National Information Services, Inc. (FIS) reported that net cash provided by operating activities was $1.0 billion in the third quarter of 2025.
The stability is further evidenced by the commitment to shareholders, with the company planning to repurchase approximately $1.3 billion of shares in 2025, supported by this strong cash generation.
- HORIZON and IBS recognized as Gartner Leaders.
- Recurring revenue is 81% of total revenue.
- Targeting over 85% Adjusted Free Cash Flow conversion.
- Banking segment growth outlook is 4.9% to 5.3% for 2025.
Finance: draft 13-week cash view by Friday.
Fidelity National Information Services, Inc. (FIS) - BCG Matrix: Dogs
Dogs, as you know, are those business units or assets Fidelity National Information Services, Inc. (FIS) has in low-growth markets with a low relative market share. They tie up capital without generating significant returns, making divestiture the typical move. For FIS as of late 2025, the primary focus for this quadrant is the planned exit from the remaining Worldpay stake and certain legacy/non-core operations.
The strategic action here is clear: minimize exposure and harvest the remaining value. The sale of the remaining Worldpay interest is the clearest example of this, moving a non-controlling interest for a significant cash infusion to fund core growth and deleveraging.
Remaining Worldpay Stake
The non-controlling 45% equity interest in the divested Merchant Solutions business, Worldpay, is being fully monetized. This move is designed to replace a non-cash generating minority interest with cash flow and strengthen the balance sheet. The agreement to sell this stake was announced in April 2025.
- Sale value to Global Payments: $6.6 billion pre-tax.
- Valuation multiple: Approximately 10.5x expected 2025 EBITDA.
- Expected closing timeframe: First half of 2026.
Legacy/Non-Strategic Products
These are older, lower-margin professional services, primarily residing within the Banking segment structure, which are not core to the future focus. While the prompt specifies a 5% decline for these products in Q2 2025, the broader 'Corporate and Other' revenue category, which often houses these non-strategic costs and revenues, showed a sharper contraction year-over-year.
Here's the quick math on the segment that likely contains these drags:
| Metric | Value/Amount (Q2 2025) | Comparison |
| Total FIS Revenue | Approximately $2.6 billion | Up 5% year-over-year (GAAP) |
| Banking Solutions Revenue | $1.81 billion | Up 5.7% year-over-year |
| Corporate and Other Revenue | $43 million | Down -24.6% year-over-year |
| Total Adjusted EBITDA | Approximately $1.0 billion | Up 5% year-over-year |
Non-Core Assets and Underperforming Geographies
The plan signals a complete exit from the merchant acquiring business via the Worldpay sale. This is a definitive action to shed assets not aligned with the strengthened core focus on Banking and Capital Markets. Any legacy international operations that do not fit this new strategic map are also candidates for minimization or divestiture, as capital is being redirected toward accretive transactions, like the Issuer Solutions acquisition.
The company's balance sheet management is key here, as the Worldpay proceeds are earmarked to help manage the debt load associated with the concurrent acquisition. As of June 30, 2025, debt outstanding stood at $12.9 billion, with a target gross leverage ratio of 2.8x to achieve post-transaction.
- Debt outstanding (June 30, 2025): $12.9 billion.
- Target Gross Leverage: 2.8x.
- Capital returned via buybacks (Q2 2025): $246 million.
- Total 2025 Share Repurchase Goal: $1.2 billion.
Finance: draft 13-week cash view by Friday.
Fidelity National Information Services, Inc. (FIS) - BCG Matrix: Question Marks
You're analyzing the parts of Fidelity National Information Services, Inc. (FIS) that are in high-growth markets but currently hold a low market share. These are the cash consumers, the ones that require heavy funding now for a potential Star payoff later. Honestly, these units are burning cash, but the potential upside in these growing arenas is why Fidelity National Information Services, Inc. (FIS) keeps writing the checks.
Issuer Solutions Business
The pending acquisition of Global Payments' Issuer Solutions business is a clear, significant bet in this quadrant. Fidelity National Information Services, Inc. (FIS) agreed to acquire this unit for an enterprise value of $13.5 billion, or a net purchase price of $12 billion. This deal, expected to close in the first half of 2026, is projected to represent a multiple of approximately 9x expected 2025 synergized EBITDA. The strategic goal is to add nearly 1 billion additional accounts to the platform. The Issuer Solutions business itself is noted to have a 4% Adj. revenue growth. Fidelity National Information Services, Inc. (FIS) expects the transaction to be accretive to Adjusted EBITDA margins, Adjusted EPS, and Adjusted Free Cash Flow within 12 months of closing. Furthermore, it is projected to unlock net EBITDA synergies of more than $150 million by year three.
Payments Business Acceleration
Fidelity National Information Services, Inc. (FIS)'s broader payments efforts are operating in a dynamic, expanding market that demands continuous investment to capture share. The U.S. payments market stands at USD 13.24 billion in 2025 and is forecast to reach USD 28.69 billion by 2030, advancing at a 16.71% CAGR through 2030. This growth is driven by migration to real-time rails like FedNow and RTP. In the second quarter of 2025, Fidelity National Information Services, Inc. (FIS)'s overall revenue grew 5% to $2.6 billion, supported by banking and payments performance. To gain share in this high-velocity environment, Fidelity National Information Services, Inc. (FIS) is focusing on higher-margin products, as CEO Stephanie Ferris noted that the company is selling more than in the last couple of years.
AI Integration Initiatives
Significant capital is being funneled into Artificial Intelligence (AI) and digital product leadership, representing a high-risk, high-reward play where market leadership is not yet secured. Fidelity National Information Services, Inc. (FIS) is on track to launch its Banker Assist solution by year-end 2025. This push follows a trend where the use of AI and machine learning in live trade finance transactions has surged by 50% in just one year, reaching 45% of respondents in 2025 from 32% in 2024. However, the path is costly; the top challenge cited for financial services firms adopting AI is high implementation costs at 74%. Substandard technology, which these new AI investments aim to replace, costs the average organization nearly $100 million annually.
Dragonfly Financial Technologies
The acquisition of Dragonfly Financial Technologies in November 2024 brings new cash management capabilities into the corporate treasury space, aligning with Fidelity National Information Services, Inc. (FIS)'s strategy to expand digital banking beyond retail. While the financial terms of the deal were not disclosed, this tuck-in is part of a broader M&A strategy, as Fidelity National Information Services, Inc. (FIS) completed five acquisitions over the past year. Dragonfly was previously sold by ACI Worldwide to One Equity Partners for $100 million in cash in June 2022. This acquisition is intended to scale services for tier-2 and tier-3 banks, helping Fidelity National Information Services, Inc. (FIS) deliver services to chief financial officers.
You need to track the cash burn versus the market penetration for these specific bets. Here's a quick look at the known investment scale and market context:
| Question Mark Initiative | Key Financial/Statistical Data Point | Contextual Metric |
| Issuer Solutions Acquisition | $13.5 billion Enterprise Value | Expected to add nearly 1 billion accounts |
| Payments Acceleration | U.S. Market Size: USD 13.24 billion in 2025 | Projected CAGR to 2030: 16.71% |
| AI Integration | High Implementation Cost Barrier: 74% | AI in Trade Finance Transactions: 45% in 2025 |
| Dragonfly Acquisition | Previous Sale Price: $100 million (June 2022) | Part of five acquisitions in the last year |
The strategy here is clear: heavy investment is required to quickly move these from low-share/high-growth to Star status, or they risk becoming Dogs. Finance: draft the 13-week cash view incorporating the funding needs for the $8 billion in new debt planned for the Issuer Solutions deal by Friday.
Disclaimer
All information, articles, and product details provided on this website are for general informational and educational purposes only. We do not claim any ownership over, nor do we intend to infringe upon, any trademarks, copyrights, logos, brand names, or other intellectual property mentioned or depicted on this site. Such intellectual property remains the property of its respective owners, and any references here are made solely for identification or informational purposes, without implying any affiliation, endorsement, or partnership.
We make no representations or warranties, express or implied, regarding the accuracy, completeness, or suitability of any content or products presented. Nothing on this website should be construed as legal, tax, investment, financial, medical, or other professional advice. In addition, no part of this site—including articles or product references—constitutes a solicitation, recommendation, endorsement, advertisement, or offer to buy or sell any securities, franchises, or other financial instruments, particularly in jurisdictions where such activity would be unlawful.
All content is of a general nature and may not address the specific circumstances of any individual or entity. It is not a substitute for professional advice or services. Any actions you take based on the information provided here are strictly at your own risk. You accept full responsibility for any decisions or outcomes arising from your use of this website and agree to release us from any liability in connection with your use of, or reliance upon, the content or products found herein.