
|
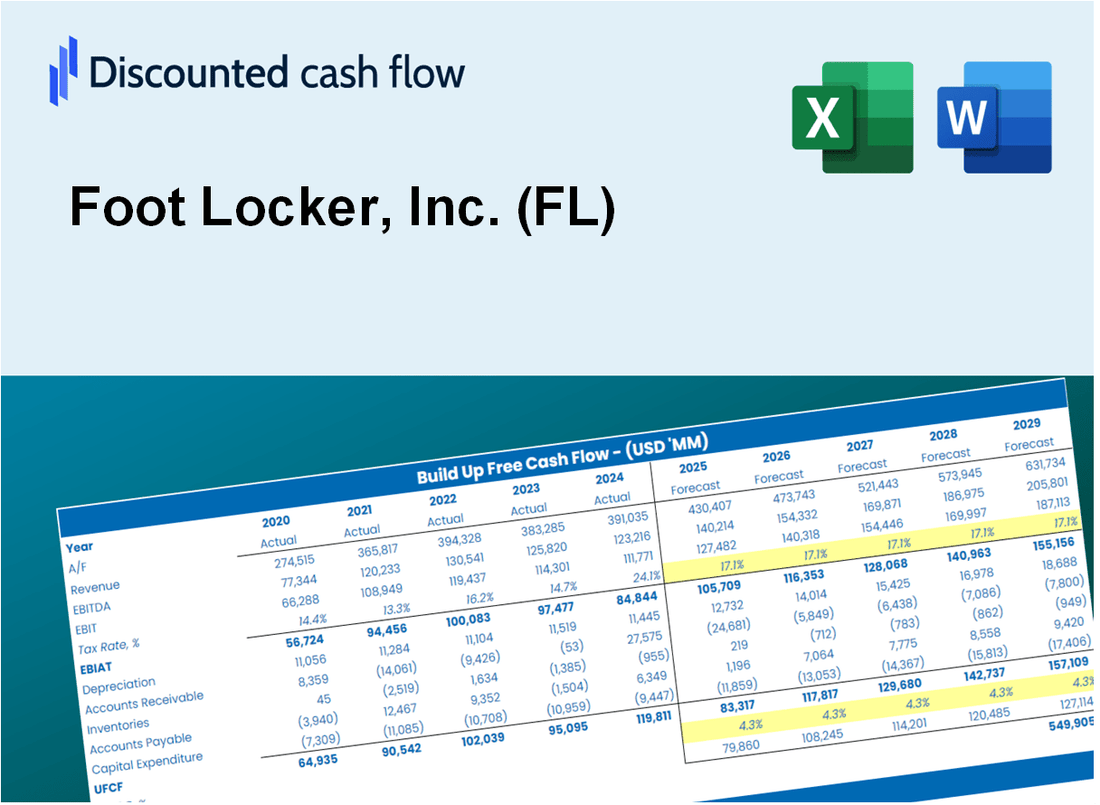
Foot Locker, Inc. (FL) DCF Valuation |
Fully Editable: Tailor To Your Needs In Excel Or Sheets
Professional Design: Trusted, Industry-Standard Templates
Investor-Approved Valuation Models
MAC/PC Compatible, Fully Unlocked
No Expertise Is Needed; Easy To Follow
Foot Locker, Inc. (FL) Bundle
Whether you’re an investor or an analyst, this Foot Locker, Inc. (FL) DCF Calculator is your essential tool for accurate valuation. Preloaded with real data from Foot Locker, you can adjust forecasts and observe the effects in real-time.
Discounted Cash Flow (DCF) - (USD MM)
| Year | AY1 2020 |
AY2 2021 |
AY3 2022 |
AY4 2023 |
AY5 2024 |
FY1 2025 |
FY2 2026 |
FY3 2027 |
FY4 2028 |
FY5 2029 |
|---|---|---|---|---|---|---|---|---|---|---|
| Revenue | 7,548.0 | 8,958.0 | 8,759.0 | 8,168.0 | 7,988.0 | 8,137.9 | 8,290.7 | 8,446.3 | 8,604.8 | 8,766.3 |
| Revenue Growth, % | 0 | 18.68 | -2.22 | -6.75 | -2.2 | 1.88 | 1.88 | 1.88 | 1.88 | 1.88 |
| EBITDA | 606.0 | 1,246.0 | 859.0 | -200.0 | 261.0 | 530.0 | 540.0 | 550.1 | 560.4 | 570.9 |
| EBITDA, % | 8.03 | 13.91 | 9.81 | -2.45 | 3.27 | 6.51 | 6.51 | 6.51 | 6.51 | 6.51 |
| Depreciation | 176.0 | 197.0 | 208.0 | 199.0 | 202.0 | 193.2 | 196.8 | 200.5 | 204.3 | 208.1 |
| Depreciation, % | 2.33 | 2.2 | 2.37 | 2.44 | 2.53 | 2.37 | 2.37 | 2.37 | 2.37 | 2.37 |
| EBIT | 430.0 | 1,049.0 | 651.0 | -399.0 | 59.0 | 336.8 | 343.1 | 349.6 | 356.1 | 362.8 |
| EBIT, % | 5.7 | 11.71 | 7.43 | -4.88 | 0.73861 | 4.14 | 4.14 | 4.14 | 4.14 | 4.14 |
| Total Cash | 1,680.0 | 804.0 | 536.0 | 297.0 | 401.0 | 748.8 | 762.9 | 777.2 | 791.8 | 806.6 |
| Total Cash, percent | .0 | .0 | .0 | .0 | .0 | .0 | .0 | .0 | .0 | .0 |
| Account Receivables | 125.0 | 134.0 | 160.0 | 160.0 | 156.0 | 144.7 | 147.4 | 150.2 | 153.0 | 155.9 |
| Account Receivables, % | 1.66 | 1.5 | 1.83 | 1.96 | 1.95 | 1.78 | 1.78 | 1.78 | 1.78 | 1.78 |
| Inventories | 923.0 | 1,266.0 | 1,643.0 | 1,509.0 | 1,525.0 | 1,345.8 | 1,371.0 | 1,396.8 | 1,423.0 | 1,449.7 |
| Inventories, % | 12.23 | 14.13 | 18.76 | 18.47 | 19.09 | 16.54 | 16.54 | 16.54 | 16.54 | 16.54 |
| Accounts Payable | 402.0 | 596.0 | 492.0 | 366.0 | 378.0 | 436.3 | 444.5 | 452.9 | 461.4 | 470.0 |
| Accounts Payable, % | 5.33 | 6.65 | 5.62 | 4.48 | 4.73 | 5.36 | 5.36 | 5.36 | 5.36 | 5.36 |
| Capital Expenditure | -159.0 | -209.0 | -285.0 | -242.0 | -240.0 | -222.3 | -226.5 | -230.8 | -235.1 | -239.5 |
| Capital Expenditure, % | -2.11 | -2.33 | -3.25 | -2.96 | -3 | -2.73 | -2.73 | -2.73 | -2.73 | -2.73 |
| Tax Rate, % | 76.47 | 76.47 | 76.47 | 76.47 | 76.47 | 76.47 | 76.47 | 76.47 | 76.47 | 76.47 |
| EBITAT | 281.2 | 755.4 | 424.9 | -311.3 | 13.9 | 204.9 | 208.8 | 212.7 | 216.7 | 220.7 |
| Depreciation | ||||||||||
| Changes in Account Receivables | ||||||||||
| Changes in Inventories | ||||||||||
| Changes in Accounts Payable | ||||||||||
| Capital Expenditure | ||||||||||
| UFCF | -347.8 | 585.4 | -159.1 | -346.3 | -24.1 | 424.7 | 159.3 | 162.3 | 165.3 | 168.4 |
| WACC, % | 6.73 | 6.86 | 6.73 | 6.98 | 5.9 | 6.64 | 6.64 | 6.64 | 6.64 | 6.64 |
| PV UFCF | ||||||||||
| SUM PV UFCF | 922.1 | |||||||||
| Long Term Growth Rate, % | 0.50 | |||||||||
| Free cash flow (T + 1) | 169 | |||||||||
| Terminal Value | 2,758 | |||||||||
| Present Terminal Value | 2,000 | |||||||||
| Enterprise Value | 2,922 | |||||||||
| Net Debt | 2,383 | |||||||||
| Equity Value | 539 | |||||||||
| Diluted Shares Outstanding, MM | 96 | |||||||||
| Equity Value Per Share | 5.65 |
What You Will Get
- Editable Forecast Inputs: Easily modify assumptions (growth %, margins, WACC) to generate various scenarios.
- Real-World Data: Foot Locker, Inc.'s (FL) financial data pre-filled to kickstart your analysis.
- Automatic DCF Outputs: The template computes Net Present Value (NPV) and intrinsic value for you.
- Customizable and Professional: A refined Excel model that adjusts to your valuation requirements.
- Built for Analysts and Investors: Perfect for evaluating projections, confirming strategies, and saving time.
Key Features
- Genuine Foot Locker Financials: Gain access to precise pre-loaded historical data and future forecasts.
- Adjustable Forecast Assumptions: Modify yellow-highlighted cells such as WACC, growth rates, and profit margins.
- Real-Time Calculations: Instant updates to DCF, Net Present Value (NPV), and cash flow assessments.
- User-Friendly Dashboard: Clear charts and summaries to help you visualize your valuation outcomes.
- Designed for All Skill Levels: An easy-to-navigate structure tailored for investors, CFOs, and consultants alike.
How It Works
- Step 1: Download the prebuilt Excel template with Foot Locker’s data included.
- Step 2: Explore the pre-filled sheets and understand the key metrics.
- Step 3: Update forecasts and assumptions in the editable yellow cells (WACC, growth, margins).
- Step 4: Instantly view recalculated results, including Foot Locker’s intrinsic value.
- Step 5: Make informed investment decisions or generate reports using the outputs.
Why Choose Foot Locker, Inc. (FL)?
- Extensive Selection: A wide variety of footwear, apparel, and accessories for all styles.
- Quality Assurance: Partnered with top brands to ensure high-quality products.
- Customer-Centric Experience: Dedicated support and services tailored to enhance customer satisfaction.
- Exclusive Offers: Access to special promotions and limited-edition releases.
- Community Engagement: Actively involved in local initiatives and youth programs.
Who Should Use This Product?
- Investors: Accurately assess Foot Locker, Inc.'s (FL) fair value prior to making investment choices.
- CFOs: Utilize a professional-grade DCF model for financial reporting and analysis at Foot Locker, Inc. (FL).
- Consultants: Seamlessly modify the template for valuation reports tailored to Foot Locker, Inc. (FL) clients.
- Entrepreneurs: Acquire insights into financial modeling practices employed by leading retail companies like Foot Locker, Inc. (FL).
- Educators: Implement it as a teaching resource to illustrate valuation techniques relevant to Foot Locker, Inc. (FL).
What the Template Contains
- Pre-Filled Data: Includes Foot Locker's historical financials and forecasts.
- Discounted Cash Flow Model: Editable DCF valuation model with automatic calculations.
- Weighted Average Cost of Capital (WACC): A dedicated sheet for calculating WACC based on custom inputs.
- Key Financial Ratios: Analyze Foot Locker's profitability, efficiency, and leverage.
- Customizable Inputs: Edit revenue growth, margins, and tax rates with ease.
- Clear Dashboard: Charts and tables summarizing key valuation results.
Disclaimer
All information, articles, and product details provided on this website are for general informational and educational purposes only. We do not claim any ownership over, nor do we intend to infringe upon, any trademarks, copyrights, logos, brand names, or other intellectual property mentioned or depicted on this site. Such intellectual property remains the property of its respective owners, and any references here are made solely for identification or informational purposes, without implying any affiliation, endorsement, or partnership.
We make no representations or warranties, express or implied, regarding the accuracy, completeness, or suitability of any content or products presented. Nothing on this website should be construed as legal, tax, investment, financial, medical, or other professional advice. In addition, no part of this site—including articles or product references—constitutes a solicitation, recommendation, endorsement, advertisement, or offer to buy or sell any securities, franchises, or other financial instruments, particularly in jurisdictions where such activity would be unlawful.
All content is of a general nature and may not address the specific circumstances of any individual or entity. It is not a substitute for professional advice or services. Any actions you take based on the information provided here are strictly at your own risk. You accept full responsibility for any decisions or outcomes arising from your use of this website and agree to release us from any liability in connection with your use of, or reliance upon, the content or products found herein.