
|
FingerMotion, Inc. (FNGR): ANSOFF MATRIX [Apr-2026 Updated] |
Fully Editable: Tailor To Your Needs In Excel Or Sheets
Professional Design: Trusted, Industry-Standard Templates
Investor-Approved Valuation Models
MAC/PC Compatible, Fully Unlocked
No Expertise Is Needed; Easy To Follow
FingerMotion, Inc. (FNGR) Bundle
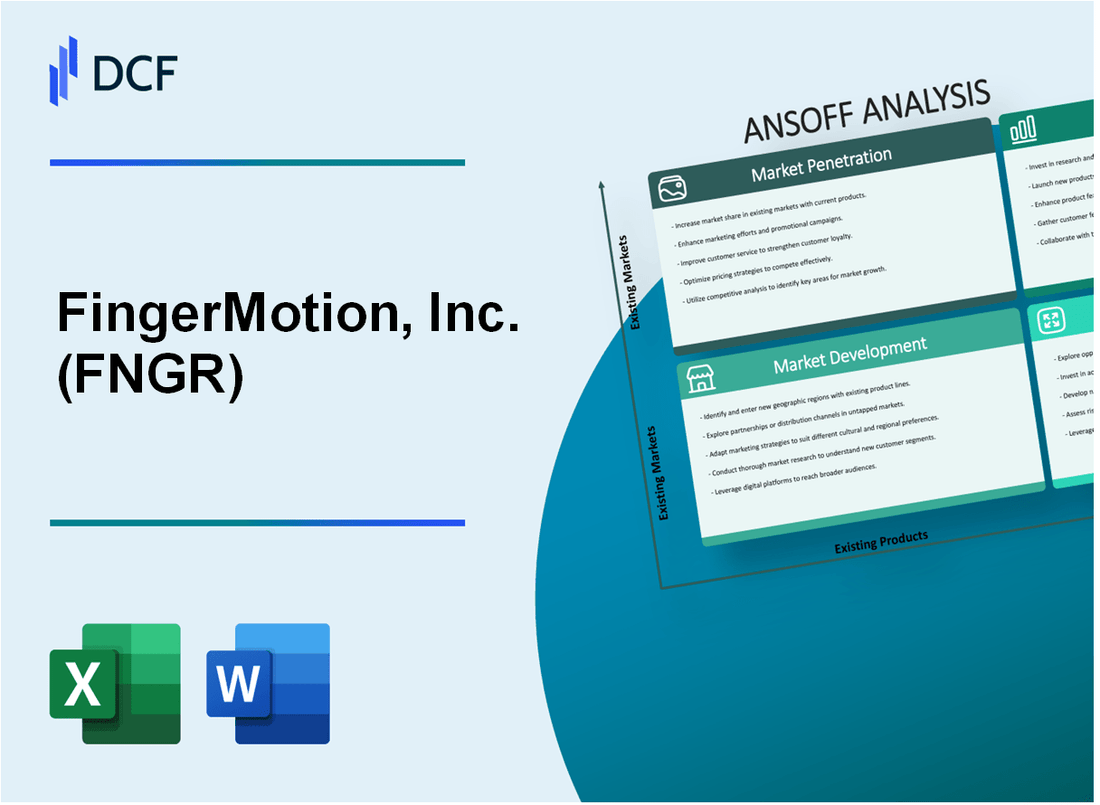
As someone who has mapped growth paths for two decades, I see FingerMotion, Inc. clearly laying out its next moves across the Chinese mobile landscape using the Ansoff Matrix. You're looking at a focused plan: from squeezing more value out of the existing 1.5 million+ subscribers-targeting a 5% ARPU lift this quarter through better service bundles-to aggressive leaps like launching FinTech or Big Data tools. Honestly, this framework cuts through the noise, showing exactly where FingerMotion, Inc. intends to deepen its hold in core markets versus where it's taking calculated, new-frontier risks. Dive in below to see the specific actions planned for Market Penetration, Development, Product innovation, and bold Diversification.
FingerMotion, Inc. (FNGR) - Ansoff Matrix: Market Penetration
You're looking at how FingerMotion, Inc. (FNGR) can squeeze more revenue from the customers it already has, which is the essence of Market Penetration. This strategy leans heavily on the existing infrastructure and relationships, like the access to wholesale rechargeable minutes from China's largest mobile phone providers that the company has secured. It's about selling more of what you already offer to the people who already know you.
The numbers from the Fiscal Year 2025 show where the existing base is shifting its spending. While the core Telecommunications Products & Services revenue saw a 17% decline to $5.59 million, the SMS & MMS business exploded, growing 206% year-over-year to reach $5.52 million in FY 2025. That's a massive internal shift in revenue mix, showing where penetration efforts are succeeding, even as the overall FY 2025 revenue was relatively flat at $35.61 million.
Here's a quick look at how the segments performed in the last full fiscal year:
| Segment | FY 2025 Revenue (USD) | Year-over-Year Change |
| SMS & MMS Business | $5.52 million | +206% |
| Telecommunications Products & Services | $5.59 million | -17% |
| Total Revenue | $35.61 million | -0.5% |
To drive this penetration, the plan centers on the current user base, which the company hopes will eventually grow to over 1 billion users in the China market. You need to maximize the value from the existing 1.5 million+ subscribers you already serve.
Increase Mobile Data and SMS package sales to existing 1.5 million+ subscribers.
The success in the SMS & MMS segment, which brought in $44,457 in Q3 2025 alone (up from $7,900 in Q3 2024), shows that upselling or increasing usage of specific services works. The focus here is definitely on pushing higher-volume data and messaging bundles to these established accounts to increase their spend.
Offer targeted, higher-margin value-added services (VAS) bundles to high-usage customers.
This is where the margin improvement comes in, especially since the overall gross profit for FY 2025 decreased by 28%. Shifting users to VAS bundles-like the mobile device protection products launched with China Mobile and China Unicom-is key. These products are designed to be embedded features, meaning they are easier to sell into the existing subscription plans of your most active users.
Run promotional campaigns to boost average revenue per user (ARPU) by 5% this quarter.
This is a clear, measurable goal for the near term. If you can achieve a 5% lift in ARPU this quarter, that directly impacts the top line, helping offset the $5.11 million net loss reported for the full FY 2025. It's a direct lever you can pull with the current customer base.
Deepen integration with existing telecom partners like China Mobile for preferential placement.
FingerMotion, Inc. (FNGR) already has cooperation agreements with major carriers like China Mobile and China Unicom to distribute its mobile device protection products. Deepening this means negotiating for better visibility or default bundling options within their existing voice, device, and data subscription plans. This preferential placement reduces customer acquisition costs for new services.
Implement a loyalty program to reduce churn in the current user base.
Reducing churn is critical when your goal is to serve a massive base, even if the current reported base is 1.5 million+. A loyalty program helps lock in those existing users, ensuring that the revenue you gain from the 5% ARPU push doesn't immediately leak out. You want to keep those high-usage customers engaged with the ecosystem you're building.
Finance: draft 13-week cash view by Friday.
FingerMotion, Inc. (FNGR) - Ansoff Matrix: Market Development
You're looking at how FingerMotion, Inc. (FNGR) can take its existing mobile services and data platforms into new geographic markets or new customer segments. This is Market Development in action, and the numbers from the fiscal year ending February 28, 2025, show a clear pivot is underway.
The core domestic expansion strategy involves pushing the Mobile Data and SMS platform deeper into China's emerging urban centers. While the legacy Telecommunications Products & Services business saw revenue drop by 17% year-over-year to $5.59 million in FY 2025, the SMS & MMS business exploded, growing revenue by 206% to reach $5.52 million. This suggests the new service delivery model is finding traction where the older one is contracting. The company has a long-term vision to eventually serve over 1 billion users in the China market before expanding the model regionally.
Focusing on new demographics, like the elderly mobile user base, requires tailoring the offering. While specific package uptake numbers aren't public, the overall strategic shift is toward high-growth segments. The DaGe Platform, an initial FY 2025 revenue contributor of $0.08 million, and the C2 Platform, with $0.19 million in FY 2025 revenue, represent the types of scalable solutions that could be simplified for new user groups.
For cross-border services, the AI and Big Data division, Sapientus, is actively strengthening collaboration and business development in Southeast Asia, following its participation in InsurInnovator Connect Asia 2025 in September 2025. This effort is about productizing existing IP for regional deployment, aligning with the strategic roadmap announced in November 2025. The company is exploring pilot opportunities in markets like Indonesia and Thailand.
Adapting the MaaS (Mobility as a Service) concept for logistics partners is part of the broader plan to monetize core competencies outside of China. The company's Value Added Products section notes securing cooperation with telecommunication providers and all its e-commerce platform partners to market to end users. This indicates an existing framework for channel integration.
Securing new distribution channels through major Chinese e-commerce platforms is a stated component of the Value Added Products strategy. Furthermore, the company has historically provided digital commerce offerings through partnerships with e-commerce platforms. The Q1 2026 results, for the period ended May 31, 2025, show the company is maintaining momentum in its new focus areas, with total revenue at $8.46 million.
Here is a snapshot of the FY 2025 revenue performance that informs this Market Development push:
| Metric | FY 2025 Amount (USD) | Year-over-Year Change |
| Total Annual Revenue | $35.61 million | -0.5% |
| SMS & MMS Business Revenue | $5.52 million | +206% |
| Telecommunications Products & Services Revenue | $5.59 million | -17% |
| DaGe Platform Revenue | $0.08 million | Initial Revenue |
| Command & Communication (C2) Revenue | $0.19 million | Initial Revenue |
The balance sheet at the end of FY 2025, February 28, 2025, shows the financial footing for these expansion efforts:
- Cash and cash equivalents: $1.13 million
- Working capital surplus: $6.90 million
- Shareholders' equity: $13.66 million
By May 31, 2025, the cash position had improved to $2.86 million, and the working capital surplus grew to $9.4 million, with shareholders' equity at $16.2 million. This suggests resources are being managed to support the next phase.
Recent segment performance from Q1 Fiscal 2026 (ended May 31, 2025) shows continued activity in new areas:
- DaGe Platform revenue: $10,938
- Command and Communication revenue: $109,241
- Big Data segment revenue: $27,310
Finance: draft 13-week cash view by Friday.
FingerMotion, Inc. (FNGR) - Ansoff Matrix: Product Development
You're looking at the numbers that underpin the Product Development thrust for FingerMotion, Inc. (FNGR). This is about building new offerings or significantly improving existing ones for the current market base.
The fiscal year 2025 results show a total revenue of $35.61M, a slight decrease of 0.5% year-over-year, alongside a net loss of $5.11M. Still, the SMS & MMS business showed a massive 206% growth, reaching $5.52M in revenue for FY 2025.
Here are the financial snapshots of product-relevant segments from the latest full fiscal year data:
| Product/Segment Focus | FY 2025 Revenue (USD) | Year-over-Year Change |
|---|---|---|
| SMS & MMS Business | $5.52M | +206% |
| Telecommunications Products & Services | $5.59M | -17% |
| DaGe Platform (New Initiative) | $0.08M | Initial Revenue |
| C2 Platform (New Initiative) | $0.19M | Initial Revenue |
| Big Data Revenue | Near Zero | Declined by 118% |
Focusing on specific product development areas:
- Launch a proprietary Big Data analytics tool for telecom operators to optimize network traffic.
- Introduce a new micro-insurance product line integrated directly into the mobile wallet app.
- Develop a premium, ad-free mobile content subscription service for existing users.
- Upgrade the core SMS platform to support rich communication services (RCS) messaging features.
- Create a B2B API service for third-party developers to access FingerMotion, Inc.'s user base.
The company maintains a long-term vision to serve over 1 billion users in the China market. The fourth quarter of fiscal 2025 showed a revenue of $10.24M, up 24.8% year-over-year, with the net loss narrowing to $-100,247. This Q4 performance resulted in an earnings per share of $0.00, compared to a loss of $0.01 in Q4 2024.
For the Big Data initiative, the performance has been challenging; Q3 2025 saw $0 revenue from Big Data, compared to $5,584 in Q3 2024. The SMS & MMS segment, which saw a 100,427% revenue increase in Q1 2025 to $8.16 million, is a clear area of current product success.
The initial revenue from the new platforms, which could be seen as early product diversification efforts, totaled $0.27M for the full fiscal year 2025 ($0.08M from DaGe and $0.19M from C2).
Finance: draft 13-week cash view by Friday.
FingerMotion, Inc. (FNGR) - Ansoff Matrix: Diversification
You're looking at FingerMotion, Inc. (FNGR) as it tries to move beyond its core, high-volume, low-margin mobile top-up business in China. Diversification here means taking the data and user ecosystem built from that core and applying it to new, potentially higher-margin areas. The company's FY 2025 total revenue was $35.61M, which was a slight dip of 0.5% year-over-year, showing the need for new growth vectors. The net loss for FY 2025 widened to $5.11M, with a loss per share of $0.09, underscoring the financial pressure to find successful new ventures. The company's cash position was tight at the end of Q3 FY2025 (November 30, 2024), with only $164,600 in cash and equivalents, though this was partially addressed by raising approximately $4.44M net in December 2024 to support initiatives.
The current revenue breakdown shows where the pivot is already happening, which informs the potential for further diversification. The SMS & MMS business, a newer focus, grew revenue by 206% year-over-year in FY 2025, reaching $5.52M. Conversely, the legacy Telecommunications Products & Services segment declined 17% to $5.59M in FY 2025. The company's vision is to grow its user base to eventually serve over 1 billion users in the China market and then expand that model regionally.
Here are the actual new ventures that represent diversification away from the core top-up business:
- The DaGe Platform, which is the Big Data arm (Sapientus), generated initial FY 2025 revenue of $0.08M.
- The Command & Communication (C2) Platform generated initial FY 2025 revenue of $0.19M.
- The company is strengthening business development for its AI and Big Data division, Sapientus, in Southeast Asia as of October 2025.
Regarding the specific diversification ideas you listed, here is what the real-life data suggests about FingerMotion, Inc. (FNGR)'s movement:
Enter the FinTech market by launching a small-scale consumer lending platform in China.
While FingerMotion, Inc. (FNGR) has a core competency in mobile payment and recharge platform solutions in China, which is adjacent to FinTech, direct financial figures for a new consumer lending platform launch are not explicitly detailed in the latest reports. The company's existing ecosystem, which involves mobile recharge and value-added products, is the foundation for potential financial service expansion. The Sapientus platform, the Big Data arm, is noted for using data to power solutions for multiple industries, including finances, such as risk scoring.
Acquire a minority stake in a promising Chinese e-sports or mobile gaming company.
There are no specific financial figures available regarding a minority stake acquisition in an e-sports or mobile gaming company as of the latest reports. The focus of reported strategic moves has been on data monetization and regional expansion outside of China.
Develop a dedicated Internet of Things (IoT) connectivity solution for industrial clients.
This area shows concrete initial traction through the Command & Communication (C2) Platform and strategic alliances. The C2 Platform generated $0.19M in revenue for the full Fiscal Year 2025. Furthermore, on June 16, 2025, FingerMotion, Inc. (FNGR) announced a partnership with Qingling Motors to develop advanced intelligent vehicle solutions, which falls under the IoT/connected vehicle space, focusing on logistics and emergency response.
Establish a new, separate business unit focused on cloud-based enterprise software (SaaS).
The C2 Platform, which provides Mobile Integrated Command and Communication solutions, functions as an enterprise-focused technology offering. In Q1 2025, management indicated expectations for cloud-based services to contribute meaningful revenue later in that fiscal year. The company's strategic roadmap announced in November 2025 emphasizes productizing existing intellectual property for deployment in broader regional markets, which aligns with a SaaS-like expansion model.
Pilot a blockchain-based digital identity and authentication service for financial institutions.
Specific financial metrics for a blockchain-based digital identity pilot are not reported. However, the company's Big Data division, Sapientus, is actively developing predictive models to isolate and extract consumer behavior and habits for future monetization, including risk scoring for the finance and insurance industries. The Q3 2025 results showed $0 revenue from the Big Data segment for that quarter, indicating these higher-value platforms are still in early monetization stages.
To put the current segment performance into perspective, here's a quick look at the revenue mix from the last reported full fiscal year:
| Business Segment | FY 2025 Revenue (Millions USD) | Year-over-Year Change |
| Total Revenue | $35.61M | -0.5% |
| Telecommunications Products & Services | $5.59M | -17% |
| SMS & MMS Business | $5.52M | +206% |
| C2 Platform (Command & Communication) | $0.19M | Initial Revenue |
| DaGe Platform (Big Data) | $0.08M | Initial Revenue |
The gross profit for Q3 2025 was $0.44M, a decline of 30% year-over-year, showing margin pressure as the cost of revenue rose faster than sales in that period. The company's total assets were $31.94 million as of November 30, 2024.
Disclaimer
All information, articles, and product details provided on this website are for general informational and educational purposes only. We do not claim any ownership over, nor do we intend to infringe upon, any trademarks, copyrights, logos, brand names, or other intellectual property mentioned or depicted on this site. Such intellectual property remains the property of its respective owners, and any references here are made solely for identification or informational purposes, without implying any affiliation, endorsement, or partnership.
We make no representations or warranties, express or implied, regarding the accuracy, completeness, or suitability of any content or products presented. Nothing on this website should be construed as legal, tax, investment, financial, medical, or other professional advice. In addition, no part of this site—including articles or product references—constitutes a solicitation, recommendation, endorsement, advertisement, or offer to buy or sell any securities, franchises, or other financial instruments, particularly in jurisdictions where such activity would be unlawful.
All content is of a general nature and may not address the specific circumstances of any individual or entity. It is not a substitute for professional advice or services. Any actions you take based on the information provided here are strictly at your own risk. You accept full responsibility for any decisions or outcomes arising from your use of this website and agree to release us from any liability in connection with your use of, or reliance upon, the content or products found herein.