
|
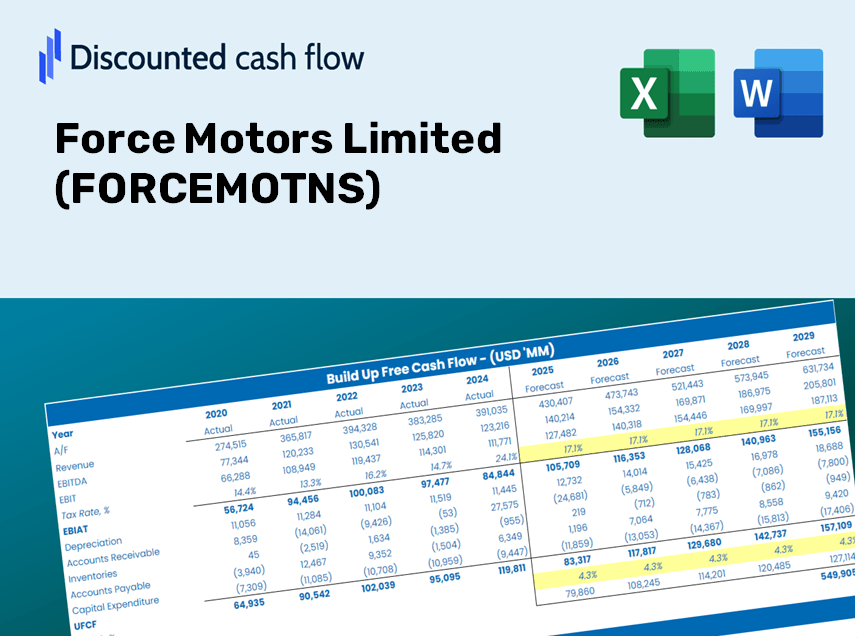
Force Motors Limited (FORCEMOT.NS) DCF Valuation |
Fully Editable: Tailor To Your Needs In Excel Or Sheets
Professional Design: Trusted, Industry-Standard Templates
Investor-Approved Valuation Models
MAC/PC Compatible, Fully Unlocked
No Expertise Is Needed; Easy To Follow
Force Motors Limited (FORCEMOT.NS) Bundle
Streamline your analysis and improve precision with our (FORCEMOTNS) DCF Calculator! Utilizing real Force Motors Limited data and customizable assumptions, this tool empowers you to forecast, evaluate, and assess (FORCEMOTNS) just like a seasoned investor.
Discounted Cash Flow (DCF) - (USD MM)
| Year | AY1 2021 |
AY2 2022 |
AY3 2023 |
AY4 2024 |
AY5 2025 |
FY1 2026 |
FY2 2027 |
FY3 2028 |
FY4 2029 |
FY5 2030 |
|---|---|---|---|---|---|---|---|---|---|---|
| Revenue | 20,007.2 | 32,404.2 | 50,289.8 | 69,921.3 | 80,717.3 | 115,352.1 | 164,848.2 | 235,582.5 | 336,668.0 | 481,128.0 |
| Revenue Growth, % | 0 | 61.96 | 55.2 | 39.04 | 15.44 | 42.91 | 42.91 | 42.91 | 42.91 | 42.91 |
| EBITDA | 530.1 | 963.8 | 3,985.0 | 9,301.7 | 11,217.1 | 9,400.7 | 13,434.4 | 19,198.9 | 27,437.0 | 39,209.8 |
| EBITDA, % | 2.65 | 2.97 | 7.92 | 13.3 | 13.9 | 8.15 | 8.15 | 8.15 | 8.15 | 8.15 |
| Depreciation | 1,736.7 | 1,909.4 | 2,373.6 | 2,640.7 | 2,770.9 | 6,114.2 | 8,737.7 | 12,486.9 | 17,844.9 | 25,501.9 |
| Depreciation, % | 8.68 | 5.89 | 4.72 | 3.78 | 3.43 | 5.3 | 5.3 | 5.3 | 5.3 | 5.3 |
| EBIT | -1,206.6 | -945.6 | 1,611.4 | 6,661.0 | 8,446.2 | 3,286.5 | 4,696.7 | 6,712.0 | 9,592.1 | 13,707.9 |
| EBIT, % | -6.03 | -2.92 | 3.2 | 9.53 | 10.46 | 2.85 | 2.85 | 2.85 | 2.85 | 2.85 |
| Total Cash | 347.2 | 721.0 | 1,403.7 | 4,481.6 | 5,074.1 | 4,486.6 | 6,411.7 | 9,162.9 | 13,094.6 | 18,713.3 |
| Total Cash, percent | .0 | .0 | .0 | .0 | .0 | .0 | .0 | .0 | .0 | .0 |
| Account Receivables | 2,699.4 | 3,008.9 | 5,858.0 | 1,040.6 | 1,743.4 | 8,783.9 | 12,553.0 | 17,939.3 | 25,636.8 | 36,637.2 |
| Account Receivables, % | 13.49 | 9.29 | 11.65 | 1.49 | 2.16 | 7.61 | 7.61 | 7.61 | 7.61 | 7.61 |
| Inventories | 5,578.2 | 6,371.3 | 8,265.5 | 11,631.9 | 11,837.6 | 21,981.5 | 31,413.4 | 44,892.5 | 64,155.4 | 91,683.6 |
| Inventories, % | 27.88 | 19.66 | 16.44 | 16.64 | 14.67 | 19.06 | 19.06 | 19.06 | 19.06 | 19.06 |
| Accounts Payable | 4,400.7 | 5,169.1 | 7,449.5 | 8,542.9 | 7,835.9 | 17,230.5 | 24,623.8 | 35,189.6 | 50,289.0 | 71,867.4 |
| Accounts Payable, % | 22 | 15.95 | 14.81 | 12.22 | 9.71 | 14.94 | 14.94 | 14.94 | 14.94 | 14.94 |
| Capital Expenditure | -4,532.4 | -4,072.1 | -2,595.2 | -2,083.8 | -3,669.0 | -11,052.3 | -15,794.6 | -22,571.9 | -32,257.2 | -46,098.4 |
| Capital Expenditure, % | -22.65 | -12.57 | -5.16 | -2.98 | -4.55 | -9.58 | -9.58 | -9.58 | -9.58 | -9.58 |
| Tax Rate, % | 35.33 | 35.33 | 35.33 | 35.33 | 35.33 | 35.33 | 35.33 | 35.33 | 35.33 | 35.33 |
| EBITAT | -848.3 | -664.3 | 790.5 | 4,272.3 | 5,461.9 | 2,093.0 | 2,991.1 | 4,274.5 | 6,108.7 | 8,729.8 |
| Depreciation | ||||||||||
| Changes in Account Receivables | ||||||||||
| Changes in Inventories | ||||||||||
| Changes in Accounts Payable | ||||||||||
| Capital Expenditure | ||||||||||
| UFCF | -7,520.9 | -3,161.2 | -1,894.0 | 7,373.6 | 2,948.3 | -10,634.9 | -9,873.5 | -14,110.1 | -20,164.6 | -28,817.0 |
| WACC, % | 6.42 | 6.42 | 6.39 | 6.41 | 6.41 | 6.41 | 6.41 | 6.41 | 6.41 | 6.41 |
| PV UFCF | ||||||||||
| SUM PV UFCF | -67,278.5 | |||||||||
| Long Term Growth Rate, % | 2.00 | |||||||||
| Free cash flow (T + 1) | -29,393 | |||||||||
| Terminal Value | -666,800 | |||||||||
| Present Terminal Value | -488,789 | |||||||||
| Enterprise Value | -556,067 | |||||||||
| Net Debt | -4,900 | |||||||||
| Equity Value | -551,168 | |||||||||
| Diluted Shares Outstanding, MM | 13 | |||||||||
| Equity Value Per Share | -41,831.19 |
What You Will Receive
- Flexible Forecast Inputs: Adjust assumptions (growth %, margins, WACC) effortlessly to explore various scenarios.
- Comprehensive Real-World Data: Force Motors Limited's (FORCEMOTNS) financial data preloaded to kickstart your analysis.
- Automated DCF Calculations: The template computes Net Present Value (NPV) and intrinsic value for you.
- Customizable and Professional Design: A sleek Excel model tailored to fit your valuation requirements.
- Designed for Analysts and Investors: Perfect for evaluating projections, confirming strategies, and enhancing efficiency.
Key Features
- 🔍 Real-Life FORCEMOTNS Financials: Pre-filled historical and projected data for Force Motors Limited.
- ✏️ Fully Customizable Inputs: Modify all essential parameters (yellow cells) such as WACC, growth %, and tax rates.
- 📊 Professional DCF Valuation: Integrated formulas calculate the intrinsic value of Force Motors using the Discounted Cash Flow method.
- ⚡ Instant Results: Visualize the valuation of Force Motors immediately after making adjustments.
- Scenario Analysis: Evaluate and compare outcomes for different financial assumptions side-by-side.
How It Operates
- 1. Access the Template: Download and open the Excel file containing Force Motors Limited’s pre-loaded data.
- 2. Adjust Assumptions: Modify essential inputs such as growth rates, WACC, and capital expenditures.
- 3. Instant Results: The DCF model automatically computes intrinsic value and NPV.
- 4. Explore Scenarios: Analyze various forecasts to evaluate different valuation results.
- 5. Present with Confidence: Deliver professional valuation insights to inform your decisions.
Why Opt for This Calculator?
- All-in-One Solution: Combines DCF, WACC, and financial ratio analyses tailored for Force Motors Limited (FORCEMOTNS).
- Flexible Inputs: Modify the yellow-highlighted cells to explore different scenarios.
- In-Depth Analysis: Automatically computes the intrinsic value and Net Present Value for Force Motors Limited (FORCEMOTNS).
- Pre-Loaded Data: Historical and projected data provide a solid foundation for accurate analysis.
- High-Quality Standards: Perfect for financial analysts, investors, and business consultants focused on Force Motors Limited (FORCEMOTNS).
Who Can Benefit from This Product?
- Investors: Evaluate Force Motors Limited’s (FORCEMOTNS) valuation prior to making investment decisions.
- CFOs and Financial Analysts: Optimize the valuation process and assess financial forecasts.
- Startup Founders: Gain insights on how leading public companies like Force Motors Limited are appraised.
- Consultants: Provide expert valuation reports for your clientele.
- Students and Educators: Utilize actual data to practice and teach valuation methodologies.
Contents of the Template
- Operating and Balance Sheet Data: Pre-filled historical data and forecasts for Force Motors Limited (FORCEMOTNS), including metrics such as revenue, EBITDA, EBIT, and capital expenditures.
- WACC Calculation: A dedicated sheet for the Weighted Average Cost of Capital (WACC), featuring parameters like Beta, risk-free rate, and share price.
- DCF Valuation (Unlevered and Levered): Customizable Discounted Cash Flow models illustrating intrinsic value with comprehensive calculations.
- Financial Statements: Pre-loaded annual and quarterly financial statements to facilitate in-depth analysis.
- Key Ratios: A collection of profitability, leverage, and efficiency ratios relevant to Force Motors Limited (FORCEMOTNS).
- Dashboard and Charts: A visual summary displaying valuation outputs and assumptions for straightforward result analysis.
Disclaimer
All information, articles, and product details provided on this website are for general informational and educational purposes only. We do not claim any ownership over, nor do we intend to infringe upon, any trademarks, copyrights, logos, brand names, or other intellectual property mentioned or depicted on this site. Such intellectual property remains the property of its respective owners, and any references here are made solely for identification or informational purposes, without implying any affiliation, endorsement, or partnership.
We make no representations or warranties, express or implied, regarding the accuracy, completeness, or suitability of any content or products presented. Nothing on this website should be construed as legal, tax, investment, financial, medical, or other professional advice. In addition, no part of this site—including articles or product references—constitutes a solicitation, recommendation, endorsement, advertisement, or offer to buy or sell any securities, franchises, or other financial instruments, particularly in jurisdictions where such activity would be unlawful.
All content is of a general nature and may not address the specific circumstances of any individual or entity. It is not a substitute for professional advice or services. Any actions you take based on the information provided here are strictly at your own risk. You accept full responsibility for any decisions or outcomes arising from your use of this website and agree to release us from any liability in connection with your use of, or reliance upon, the content or products found herein.