
|
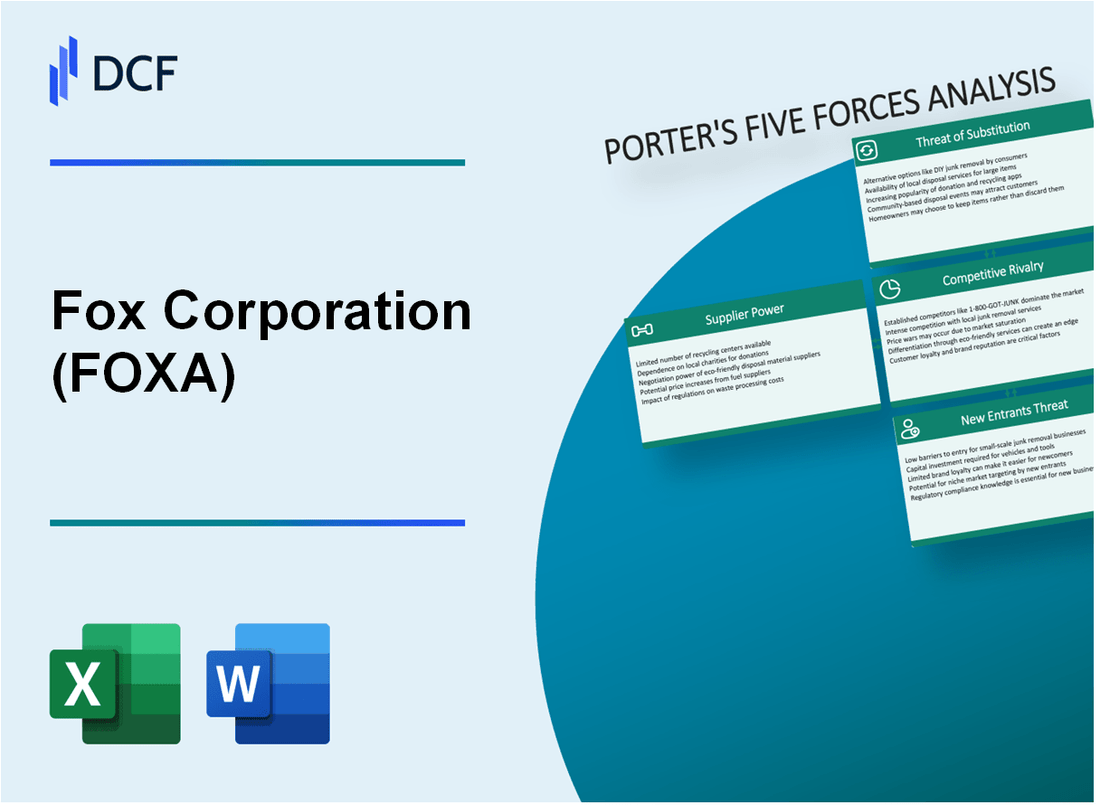
Fox Corporation (FOXA): 5 Forces Analysis [Jan-2025 Updated] |
Fully Editable: Tailor To Your Needs In Excel Or Sheets
Professional Design: Trusted, Industry-Standard Templates
Investor-Approved Valuation Models
MAC/PC Compatible, Fully Unlocked
No Expertise Is Needed; Easy To Follow
Fox Corporation (FOXA) Bundle
In the dynamic landscape of media and entertainment, Fox Corporation navigates a complex ecosystem shaped by Michael Porter's Five Forces. As streaming platforms disrupt traditional broadcasting and content creation becomes increasingly competitive, Fox must strategically maneuver through challenges of supplier power, customer preferences, rivalry, substitution threats, and potential new market entrants. This analysis unveils the intricate dynamics that define Fox Corporation's competitive positioning in 2024, offering insights into how the media giant maintains its strategic edge in an ever-evolving digital entertainment marketplace.
Fox Corporation (FOXA) - Porter's Five Forces: Bargaining power of suppliers
Limited Number of Major Content Creators and Production Studios
As of 2024, the content creation landscape shows significant concentration:
| Major Content Providers | Annual Content Budget |
|---|---|
| Disney | $33 billion |
| Netflix | $17 billion |
| Warner Bros. Discovery | $15.5 billion |
| Amazon Prime Video | $16.6 billion |
High Costs Associated with Acquiring TV and Film Rights
Content acquisition costs demonstrate substantial financial barriers:
- Average scripted TV series production cost: $5.1 million per episode
- Feature film production cost range: $40 million to $250 million
- Streaming platform exclusive rights acquisition: $500,000 to $10 million per title
Significant Investments Required for Original Content Production
| Content Type | Average Production Cost | Annual Investment |
|---|---|---|
| Original Drama Series | $7 million per episode | $84 million per season |
| Original Comedy Series | $3.5 million per episode | $42 million per season |
| Animated Series | $1.5 million per episode | $18 million per season |
Dependence on Key Talent and Creative Professionals
Talent compensation statistics:
- Top TV series lead actor salary: $1 million per episode
- Established film directors fee: $10 million to $20 million per project
- Screenwriter compensation: $100,000 to $1 million per script
Fox Corporation (FOXA) - Porter's Five Forces: Bargaining power of customers
Diverse Media Consumption Options for Viewers
As of Q4 2023, streaming platforms market share breakdown:
| Platform | Market Share (%) |
|---|---|
| Netflix | 31.2% |
| Amazon Prime Video | 22.7% |
| Hulu | 13.5% |
| Disney+ | 11.8% |
| Fox-owned platforms | 5.3% |
Growing Streaming Platform Competition
Streaming platform subscriber numbers in 2023:
- Netflix: 260.8 million global subscribers
- Amazon Prime Video: 200 million subscribers
- Disney+: 157.8 million subscribers
- Hulu: 48.3 million subscribers
Price-Sensitive Audience with Multiple Entertainment Choices
Average monthly streaming subscription costs:
| Platform | Monthly Cost ($) |
|---|---|
| Netflix Basic | 8.99 |
| Hulu | 7.99 |
| Disney+ | 7.99 |
| HBO Max | 9.99 |
Increasing Demand for Personalized Content Experiences
Content personalization market size projections:
- 2023 global market value: $7.6 billion
- Projected 2027 market value: $18.5 billion
- Compound Annual Growth Rate (CAGR): 24.5%
Fox Corporation (FOXA) - Porter's Five Forces: Competitive rivalry
Media Network Competitive Landscape
As of Q4 2023, Fox Corporation faces significant competitive rivalry in the media landscape:
| Competitor | Market Share | Annual Revenue (2023) |
|---|---|---|
| NBC Universal | 16.5% | $36.2 billion |
| CBS/Paramount | 14.3% | $32.7 billion |
| Disney | 22.8% | $88.9 billion |
| Fox Corporation | 8.7% | $14.6 billion |
Streaming Platform Competition
Streaming platform market metrics for 2023:
- Netflix: 231 million global subscribers
- Disney+: 157.8 million subscribers
- Hulu: 48.2 million subscribers
- Amazon Prime Video: 200 million subscribers
Content Investment Metrics
| Company | Content Investment 2023 | Original Content Titles |
|---|---|---|
| Netflix | $17.7 billion | 1,456 titles |
| Disney | $25.3 billion | 1,102 titles |
| Fox Corporation | $4.2 billion | 385 titles |
Market Fragmentation Indicators
Media market concentration metrics:
- Top 4 media companies control 62.3% of market share
- Number of active media platforms: 127
- Average viewer uses 3.4 streaming services
Fox Corporation (FOXA) - Porter's Five Forces: Threat of substitutes
Proliferation of Streaming Services
As of Q4 2023, the global streaming market reported the following subscriber numbers:
| Streaming Platform | Global Subscribers |
|---|---|
| Netflix | 260.8 million |
| Amazon Prime Video | 200 million |
| Disney+ | 157.8 million |
| Hulu | 48.3 million |
User-Generated Content Platforms
User-generated content platforms demonstrate significant market penetration:
| Platform | Monthly Active Users |
|---|---|
| YouTube | 2.5 billion |
| TikTok | 1.5 billion |
Digital Entertainment Alternatives
Digital entertainment market segments:
- Gaming revenue: $184.4 billion in 2023
- Esports viewership: 640 million global viewers
- Podcast listeners: 464.7 million worldwide
On-Demand and Mobile Content Consumption
Mobile content consumption statistics:
- Mobile video consumption: 75% of global video viewing
- Average mobile video watch time: 40 minutes per day
- Smartphone video content growth rate: 18% annually
Fox Corporation (FOXA) - Porter's Five Forces: Threat of new entrants
High Initial Capital Requirements for Media Production
Fox Corporation's media production costs in 2023 were $6.2 billion. The average cost of producing a single scripted television series ranges from $3.5 million to $7 million per episode.
| Production Category | Average Cost |
|---|---|
| Scripted TV Series | $5.5 million per episode |
| Sports Broadcasting Rights | $1.9 billion annually |
| Content Development | $750 million per year |
Complex Regulatory Environment in Media Broadcasting
FCC licensing fees for television broadcasters range from $30,000 to $500,000 annually. Compliance costs for media regulations can exceed $2.5 million per year.
Established Brand Recognition and Content Libraries
Fox Corporation owns approximately 18,000 hours of content library valued at $3.4 billion as of 2023.
- Fox News content library: 5,200 hours
- Fox Sports content library: 4,500 hours
- Fox Entertainment content library: 8,300 hours
Technological Barriers to Entry in Media Distribution
Digital infrastructure investment for media distribution requires approximately $450 million in initial capital expenditure.
| Technology Investment | Cost |
|---|---|
| Streaming Platform Development | $180 million |
| Content Delivery Network | $125 million |
| Digital Rights Management | $95 million |
Significant Marketing and Distribution Infrastructure
Fox Corporation's marketing and distribution expenses in 2023 totaled $1.2 billion.
- Digital marketing budget: $380 million
- Traditional advertising spend: $620 million
- Distribution network maintenance: $200 million
Disclaimer
All information, articles, and product details provided on this website are for general informational and educational purposes only. We do not claim any ownership over, nor do we intend to infringe upon, any trademarks, copyrights, logos, brand names, or other intellectual property mentioned or depicted on this site. Such intellectual property remains the property of its respective owners, and any references here are made solely for identification or informational purposes, without implying any affiliation, endorsement, or partnership.
We make no representations or warranties, express or implied, regarding the accuracy, completeness, or suitability of any content or products presented. Nothing on this website should be construed as legal, tax, investment, financial, medical, or other professional advice. In addition, no part of this site—including articles or product references—constitutes a solicitation, recommendation, endorsement, advertisement, or offer to buy or sell any securities, franchises, or other financial instruments, particularly in jurisdictions where such activity would be unlawful.
All content is of a general nature and may not address the specific circumstances of any individual or entity. It is not a substitute for professional advice or services. Any actions you take based on the information provided here are strictly at your own risk. You accept full responsibility for any decisions or outcomes arising from your use of this website and agree to release us from any liability in connection with your use of, or reliance upon, the content or products found herein.