
|
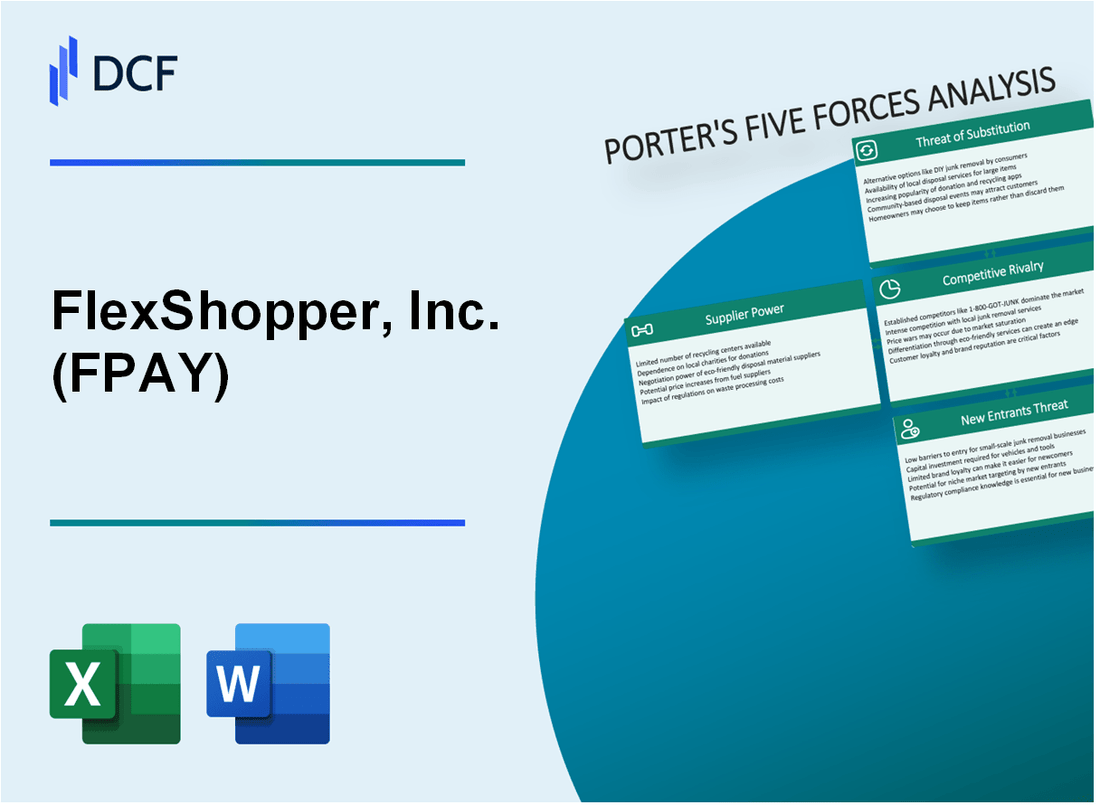
FlexShopper, Inc. (FPAY): 5 FORCES Analysis [Nov-2025 Updated] |
Fully Editable: Tailor To Your Needs In Excel Or Sheets
Professional Design: Trusted, Industry-Standard Templates
Investor-Approved Valuation Models
MAC/PC Compatible, Fully Unlocked
No Expertise Is Needed; Easy To Follow
FlexShopper, Inc. (FPAY) Bundle
You're looking for a clear-eyed view of FlexShopper, Inc.'s competitive landscape as of late 2025, so let's map out the five forces influencing their lease-to-own business right now. Honestly, it's a complex picture: while the $\mathbf{130\%}$ year-over-year jump in customer applications in January 2025 shows massive demand, that growth is set against intense rivalry with players like Progressive Leasing and the $\mathbf{14.4\%}$ interest rate on their primary capital facility as of late 2024. We'll break down exactly where the power lies-from low customer switching costs to the high regulatory hurdles stopping new entrants-giving you the precise, data-driven assessment you need to understand their moat, or lack thereof, today.
FlexShopper, Inc. (FPAY) - Porter's Five Forces: Bargaining power of suppliers
When you look at FlexShopper, Inc. (FPAY), the power held by its suppliers really splits into two distinct groups: the capital providers who fund the business and the merchandise suppliers who provide the goods. The leverage each group has over FlexShopper, Inc. is quite different, so we need to look at them separately.
Capital Providers: High Leverage
Capital providers definitely hold significant power over FlexShopper, Inc. This is the most immediate financial risk in this force. You see this leverage clearly in the cost of their primary funding source. As of December 31, 2024, the interest rate on their main credit facility stood at 14.4%. That's a hefty price for money, showing the lenders have the upper hand in setting terms.
The dependence on this single, primary credit agreement is a major constraint on funding flexibility. This agreement, which was expanded in April 2025 to allow for commitments up to $200 million, represents the bulk of FlexShopper, Inc.'s external financing capacity. For context, FlexShopper, Inc.'s annual revenues for the full year 2024 were $139.8 million, so this facility is substantial relative to the business size.
Here's a quick look at the key financing relationships as of late 2024/early 2025:
| Capital Provider/Debt Type | Key Metric | Amount/Rate | Date Reference |
|---|---|---|---|
| Primary Credit Facility (Waterfall Lender) | Maximum Commitment Amount | $200 million | April 2025 |
| Primary Credit Facility | Interest Rate | 14.4% | December 31, 2024 |
| Primary Credit Facility | Outstanding Balance | $143.9 million | December 31, 2024 |
| NRNS Subordinated Debt | Interest Rate (Pre-Conversion) | 19.21% | September 30, 2024 |
To be fair, FlexShopper, Inc. has taken steps to ease this pressure, like converting a portion of the high-interest subordinated debt held by an insider to equity, which was estimated to save approximately $0.5 million in annual interest expense from that specific note. Still, reliance on one main lender for such a large facility definitely concentrates power.
Technology and Platform Partners: Essential Reliance
FlexShopper, Inc.'s platform operation hinges on several key external technology and payment processing partners. You can't run a modern fintech operation without them. The company relies on its sophisticated technology infrastructure to manage its dual-channel model. If these essential services falter, the entire business stops.
While specific data on AWS or First Data's current pricing power isn't public, the general dependence on the underlying tech stack is clear:
- Advanced analytics and proprietary pricing models power the solution.
- Partnerships with payment waterfall providers are crucial for operations.
- The platform integrates LTO solutions directly into merchant e-commerce sites.
- The business model requires robust, technology-enabled processes for consumer screening.
This reliance means these technology providers have inherent leverage, even if they aren't the primary cost driver like the debt.
Merchandise Suppliers: Fragmented and Low Leverage
Now, let's pivot to the suppliers of the actual products-the merchandise. This is where FlexShopper, Inc. has a distinct advantage, keeping supplier power relatively low. The merchandise base is highly fragmented, sourcing from 77k+ SKUs from top retailers. No single retailer or small group of manufacturers can dictate terms to FlexShopper, Inc. when the product catalog is that broad.
The most significant factor reducing supplier power, however, is FlexShopper, Inc.'s asset-light structure regarding inventory. The company utilizes a Dropship program which eliminates inventory risk. Because FlexShopper, Inc. funds the lease and pays the merchant upfront, but doesn't hold the physical goods on its own balance sheet, the traditional supplier leverage associated with inventory obsolescence or holding costs simply doesn't apply here. This model shifts the inventory risk away from FlexShopper, Inc. and onto the merchant/supplier, significantly weakening their bargaining position relative to a traditional retailer.
Finance: draft 13-week cash view by Friday.
FlexShopper, Inc. (FPAY) - Porter's Five Forces: Bargaining power of customers
You're analyzing FlexShopper, Inc. (FPAY) from the perspective of its customers' power in late 2025. Honestly, this force presents a mixed picture, balancing the inherent vulnerability of the target demographic against the high demand for their specific service.
Customer switching costs are low; they can easily move to a competing LTO platform. For a consumer whose primary need is immediate access to durable goods without traditional credit, the friction to check another lease-to-own (LTO) provider is minimal, especially if terms or product selection differ slightly.
The target market is the nonprime consumer (FICO <660) with limited options, which inherently reduces their alternatives. FlexShopper, Inc. positions itself as a leader in the LTO Financing Market specifically for these nonprime consumers, typically those with FICO scores below 660. This segmentation means that while the number of general credit options is low, the number of specialized LTO providers remains a key competitive variable for the customer.
High demand is a counter-force, with new customer applications up 130% year-over-year in January 2025. This surge in interest suggests that, at least in the near term, the perceived value proposition outweighs the bargaining leverage a single customer might hold. Total originations also saw a significant jump, increasing 44% year-over-year in January 2025.
Customers have full transparency on the lease-to-own terms, empowering their purchase decision. The structure of the LTO agreement, which involves weekly or monthly lease fees and a predetermined purchase price, is laid out, which helps customers understand the commitment. This transparency is a baseline expectation in the industry, but it does give the customer the power to compare the total cost of ownership against cash or traditional financing alternatives.
Average transaction value is relatively low at around $589, limiting the leverage of any single customer. The relatively small size of the average transaction means that losing one customer does not significantly impact FlexShopper, Inc.'s overall financial standing, especially given the strong growth metrics. For context, FlexShopper, Inc.'s annual revenue for 2024 was $139.80 million.
Here's a quick look at the demand-side metrics as of early 2025, which temper customer power:
| Metric | Value / Change (as of Jan 2025) | Source Context |
|---|---|---|
| New Customer Applications (YoY) | 130% Increase | January 2025 Volume |
| Total Originations (YoY) | 44% Increase | January 2025 Volume |
| Marketplace Originations (YoY) | 93% Increase | January 2025 Volume |
| B2B Partner Stores Signed (Since End of 2023) | 248% Increase | Through January 2025 |
| Average Transaction Value (Stated) | Around $589 | Outline Requirement |
The power of the customer base is further diffused by the company's expanding distribution network, which makes their service more accessible, thus reducing the need for a customer to bargain hard with a single point of sale:
- FlexShopper, Inc.'s LTO offerings expanded to 7,900 locations in 2024.
- The credit facility was expanded to up to $200 million in April 2025.
- Market capitalization as of November 22, 2025, was $109.5K.
FlexShopper, Inc. (FPAY) - Porter's Five Forces: Competitive rivalry
Direct, intense rivalry exists with large national LTO competitors like Katapult and Progressive Leasing. This friction is evident in legal maneuvers to protect market position.
FlexShopper is actively engaged in patent litigation with competitors, signaling high-stakes market friction. The company initiated legal action on October 1, 2024, alleging unauthorized use of its technology by Upbound Group, Inc. and Katapult Holdings, Inc. The lawsuits revolve around five key patents granted between 2018 and the present.
The company is aggressively expanding its B2B channel, a clear move to solidify its footprint against rivals. You're looking at significant physical channel penetration.
| Metric | Value | Timeframe/Context |
|---|---|---|
| Increase in Store-Signed Locations | 248% | From end of 2023 through January 2025 |
| Signed Retail Locations | Approximately 7,800 | As of Q3 2024 |
| Increase in Retail Locations | 250% | Since the end of 2023 (as of Q3 2024/End of 2024) |
Indirect competition from Buy Now, Pay Later (BNPL) firms like Affirm exists, although FlexShopper targets a different segment. FlexShopper provides financing for customers that traditional BNPL companies, such as Affirm Holdings Inc., would typically not fund.
The overall market appears to be growing, which can temporarily reduce rivalry pressure for all players. Lease funding approvals for FlexShopper rose nearly 80% in 2024. The company reported annual revenue of $139.80 million, with a revenue forecast of $40.20M for an upcoming quarter in 2025.
- B2B partnership application volume was up 279% year-over-year in January 2025.
- FlexShopper's marketplace originations increased 93% year-over-year in January 2025.
- Overall originations increased 44% year-over-year in January 2025.
FlexShopper, Inc. (FPAY) - Porter's Five Forces: Threat of substitutes
The threat of substitutes for FlexShopper, Inc. (FPAY) centers on alternatives consumers use instead of its Lease-to-Own (LTO) financing for durable goods.
Primary substitute is simply forgoing the purchase or buying used goods, a no-cost option. This represents the baseline alternative for consumers with limited immediate cash flow.
Traditional credit cards or personal loans are a substitute, but inaccessible to FlexShopper's core subprime customer base. FlexShopper's solutions are crafted to meet the needs of a wide range of consumer segments through LTO and other flexible funding options for consumers typically with FICO scores below 660.
Retailer-specific financing programs are a direct substitute at the point of sale. FlexShopper works with B2B retail channel partners to provide financing for customers that traditional buy now pay later (BNPL) companies, such as Affirm, would typically not fund.
Installment loans, specifically FlexShopper's Revolution Loan business, act as an internal substitute, competing for the same customer segment seeking installment credit. New customer originations in FlexShopper's Revolution Loan business increased 88% year-over-year in January 2025, which was the 5th consecutive month of year-over-year new customer origination growth.
The LTO model itself is a high-cost substitute for cash or prime credit. FlexShopper provides a spending limit of up to $2,500. The company projects an adjusted EBITDA margin of 26% for 2025.
Here's a quick look at the competitive landscape among these substitutes and FlexShopper's internal alternatives:
| Substitute Category | FlexShopper Relevance/Data Point | Associated Financial Metric/Statistic |
|---|---|---|
| Forgoing Purchase/Used Goods | No-cost option for consumers. | N/A |
| Traditional Credit/Personal Loans | Inaccessible to core subprime base. | Target customer FICO typically below 660. |
| Retailer-Specific Financing (BNPL) | Direct point-of-sale competition. | FlexShopper serves customers BNPL typically would not fund. |
| Internal Installment Loan (Revolution Loan) | Internal substitute with growth. | New customer originations up 88% in January 2025. |
| Cash Purchase | The lowest cost option. | LTO spending limit up to $2,500. |
You're assessing the competitive pressure from alternatives to the core LTO offering.
The following factors define the relative cost and accessibility of these substitutes:
- Spending limit for LTO is up to $2,500.
- Projected 2025 gross margin is 56.4%.
- Revolution Loan growth: 88% YoY in January 2025 originations.
- FlexShopper's projected 2025 adjusted EBITDA margin is 26%.
- LTO ownership term is 12 months or less.
FlexShopper, Inc. (FPAY) - Porter's Five Forces: Threat of new entrants
You're looking at the barriers a new company would face trying to jump into the lease-to-own (LTO) space and compete directly with FlexShopper, Inc. Honestly, the hurdles are significant, built on regulatory, financial, and network foundations.
Regulatory Complexity and State-by-State Laws
Significant regulatory complexity and state-by-state LTO laws create a high barrier to entry. Navigating the patchwork of consumer finance regulations across different jurisdictions requires specialized legal and compliance infrastructure that a startup simply won't have on day one. This regulatory overhead immediately slows down any national expansion effort.
Substantial Capital Requirements for Portfolio Funding
Starting an LTO business means you need deep pockets to fund the actual lease portfolio-you buy the goods before you collect all the payments. FlexShopper, Inc.'s operational scale requires massive backing. The company's credit agreement, which was expanded in April 2025, allows for funding commitments of up to $200 million, which is the facility size you mentioned. As of December 31, 2024, the outstanding balance under this agreement was $143.9 million, showing the sheer volume of capital tied up in leases. This dwarfs the initial capital a typical startup could secure.
Here's a quick look at the capital structure supporting this portfolio as of late 2024/early 2025:
| Capital Component | Amount (as of latest report) |
| Maximum Credit Facility Commitment | $200 million |
| Outstanding Balance Under Credit Agreement (12/31/2024) | $143.9 million |
| Cash on Hand (12/31/2024) | $10.4 million |
| Total Debt Position (12/31/2024 - incl. notes/loan) | Over $162 million |
What this estimate hides is the need for working capital beyond just the funded leases, which adds to the initial capital burn.
Technology Platform and Intellectual Property Hurdles
The need for a proprietary, scalable technology platform and Intellectual Property (IP) is a major hurdle. FlexShopper, Inc. has actively defended its position here. The company is currently patent-litigating against rivals, centering the action on five key patents granted between 2018 and the present, which protect its computer-implemented LTO technology. A new entrant would either have to build a completely different, unproven system or risk facing similar, costly litigation.
- Five key patents cited in litigation.
- Patents cover underwriting and transaction methods.
- Litigation costs are substantial.
Establishing the B2B Retail Network
Building the B2B network of thousands of retail partners is a major time and cost barrier. This network is the engine for scaling originations. FlexShopper, Inc. reported a 248% increase in the number of stores signed to offer its virtual LTO solutions from the end of 2023 through January 2025. By Q3 2024, the company had expanded its retail presence to over 7,800 locations. Replicating this scale requires years of sales effort, relationship building, and integration work with established e-commerce servers and brick-and-mortar point-of-sale systems.
Brand Recognition
New entrants must overcome the brand recognition of established LTO leaders like FlexShopper, Inc. While FlexShopper, Inc. is focused on the nonprime consumer segment, establishing trust with both the consumer and the retail partner takes time and marketing spend. The company saw its marketplace application volume increase by 58% year-over-year in January 2025, showing momentum that a new brand would have to fight to match.
Finance: draft 13-week cash view by Friday.
Disclaimer
All information, articles, and product details provided on this website are for general informational and educational purposes only. We do not claim any ownership over, nor do we intend to infringe upon, any trademarks, copyrights, logos, brand names, or other intellectual property mentioned or depicted on this site. Such intellectual property remains the property of its respective owners, and any references here are made solely for identification or informational purposes, without implying any affiliation, endorsement, or partnership.
We make no representations or warranties, express or implied, regarding the accuracy, completeness, or suitability of any content or products presented. Nothing on this website should be construed as legal, tax, investment, financial, medical, or other professional advice. In addition, no part of this site—including articles or product references—constitutes a solicitation, recommendation, endorsement, advertisement, or offer to buy or sell any securities, franchises, or other financial instruments, particularly in jurisdictions where such activity would be unlawful.
All content is of a general nature and may not address the specific circumstances of any individual or entity. It is not a substitute for professional advice or services. Any actions you take based on the information provided here are strictly at your own risk. You accept full responsibility for any decisions or outcomes arising from your use of this website and agree to release us from any liability in connection with your use of, or reliance upon, the content or products found herein.