
|
First Bank (FRBA): ANSOFF MATRIX [Dec-2025 Updated] |
Fully Editable: Tailor To Your Needs In Excel Or Sheets
Professional Design: Trusted, Industry-Standard Templates
Investor-Approved Valuation Models
MAC/PC Compatible, Fully Unlocked
No Expertise Is Needed; Easy To Follow
First Bank (FRBA) Bundle
Honestly, First Bank has a solid base-total assets over $4.03 billion in Q3 2025, with a proven efficiency ratio under 60%-but now you need a precise growth playbook to manage that 105% loan-to-deposit ratio and push profitability. I've mapped out four distinct strategies using the Ansoff Matrix, ranging from low-risk Market Penetration tactics, like boosting non-interest-bearing deposits, all the way to high-potential Diversification moves, such as acquiring a niche FinTech firm. You need to see these actionable steps below to decide where to deploy capital next.
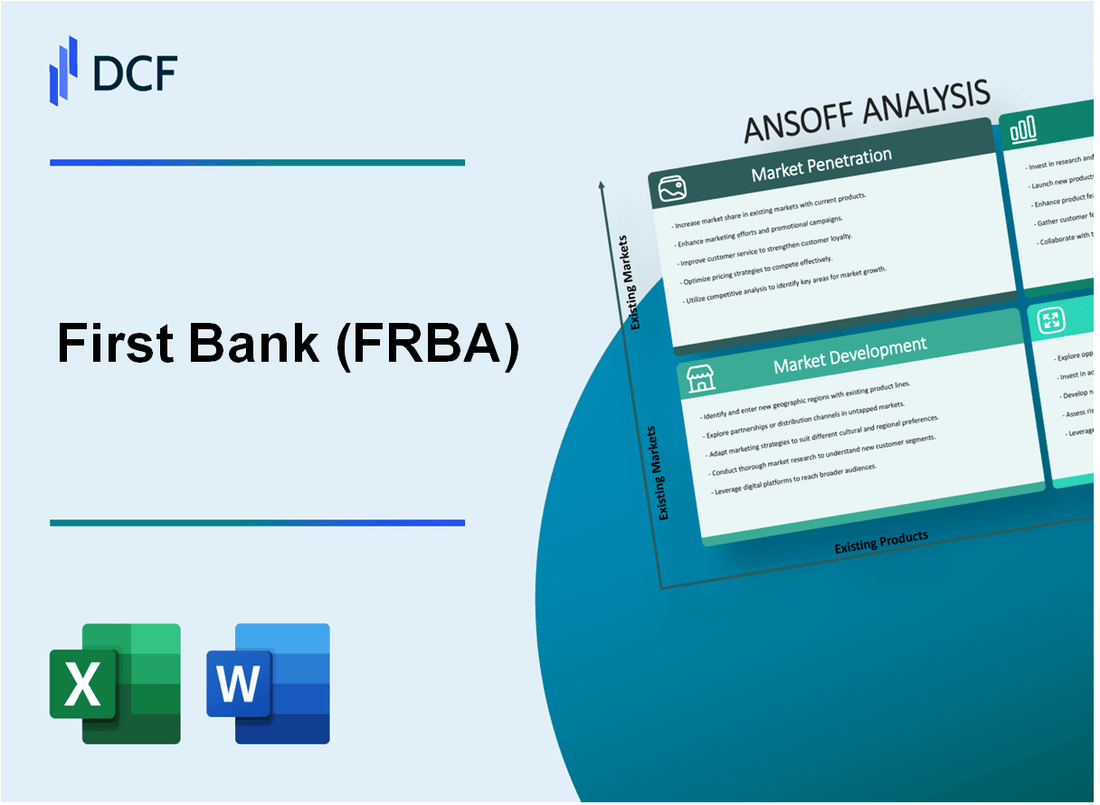
First Bank (FRBA) - Ansoff Matrix: Market Penetration
Market Penetration focuses on increasing market share within existing markets using existing products. For First Bank (FRBA), this involves deepening relationships with the current customer base across its primary operating region, the New York-to-Philadelphia corridor.
A key component is managing funding costs by growing non-interest-bearing deposits. The total deposit base stood at $3.22 billion as of September 30, 2025. Compared to December 31, 2024, non-interest bearing demand deposits increased by $59.0 million to comprise 18.0% of total deposits. Average non-interest-bearing deposits grew by $21 million during the third quarter of 2025 and by $52 million year to date as of Q3 2025.
The bank intensified cross-selling efforts to existing Commercial and Industrial (C&I) loan clients. In Q2 2025, three-quarters of the net loan growth came from the strategic C&I and owner-occupied segments. The C&I segment comprised 68% of the quarter-end lending pipeline in Q2 2025.
To manage the loan-to-deposit ratio, which reached 105% in Q2 2025, targeted Certificate of Deposit (CD) promotions were run. Time deposits increased by $26 million during Q2 2025 due to these promotions, and overall time deposits increased by $145.7 million to comprise 26.5% of total deposits as of September 30, 2025, compared to December 31, 2024.
Optimizing branch performance is critical to maintaining efficiency. The efficiency ratio for the third quarter of 2025 measured 51.81%, improving from 56.13% in the linked quarter. This metric remained below 60% for the 25th consecutive quarter as of Q3 2025.
The focus on deepening middle-market commercial relationships is evident in the balance sheet composition as of September 30, 2025, relative to year-end 2024.
| Deposit Category (as of 9/30/2025) | Percentage of Total Deposits | Change from 12/31/2024 |
| Non-interest bearing demand deposits | 18.0% | Up from 17.0% |
| Interest bearing demand deposits | 17.4% | Down from 20.6% |
| Money market and savings deposits | 38.1% | Down from 39.2% |
| Time deposits | 26.5% | Up from 23.2% |
The operational metrics show consistent performance against the efficiency target:
- Efficiency Ratio Q3 2025: 51.81%
- Consecutive Quarters Below 60% Efficiency: 25
- Loan-to-Deposit Ratio Q2 2025: 105%
- Total Deposits Q3 2025: $3.22 billion
- Total Loans Q3 2025: $3.37 billion
The growth in time deposits during Q2 2025 was $73.4 million for the first six months of 2025. Average cost of interest-bearing deposits declined by 2 basis points to 3.27% in Q3 2025.
First Bank (FRBA) - Ansoff Matrix: Market Development
You're looking at how First Bank (FRBA) can take its existing products-like its commercial and specialized lending services-and push them into new geographic territories. This is Market Development, and the numbers show where the current momentum is coming from.
Strategically opening new full-service branches in high-growth areas of current states (NJ, PA, FL) builds on recent activity. You saw the bank open branches in Trenton, NJ, and Media, PA, in Fall 2024 to reinforce its footprint across the New York City to Philadelphia corridor. The Florida presence, currently anchored by the Palm Beach County location, is key for regional testing.
Here's a quick look at the balance sheet growth supporting this expansion push through the third quarter of 2025:
| Metric | Q1 2025 (3/31/25) | Q2 2025 (6/30/25) | Q3 2025 (9/30/25) |
| Total Assets | $3.88 billion | $4.02 billion | $4.03 billion |
| Total Loans | $3.24 billion | $3.33 billion | $3.37 billion |
| Total Deposits | $3.12 billion | $3.17 billion | $3.22 billion |
| Net Interest Margin | 3.65% | 3.65% | 3.71% |
The Private Equity Fund Banking portfolio is a clear target for expansion beyond current borders. That portfolio stood at $128 million as of Q1 2025. The strategy here is to move into adjacent states like Delaware or Maryland, using the established expertise to capture new fund relationships outside the core NJ/PA/FL zone. This leverages a high-growth unit, which, along with asset-based lending, was significantly ahead of plan for net loan growth through June 2025.
You can use the existing Florida branch as the operational hub to pilot a digital-first commercial lending push across the Southeast. This aligns with the bank's stated evolution from a traditional community bank into a full-service, middle market commercial bank. The loan growth has been robust, with total loans increasing by $91.8 million annualized in Q1 2025 and another $91.2 million annualized in Q2 2025. The digital push aims to scale this origination capability geographically without immediately requiring physical infrastructure.
Acquiring a smaller, non-competing community bank remains a viable path to immediately gain a new regional footprint, similar to the Malvern Bancorp acquisition in July 2023 which added $996.3 million in assets. This M&A strategy provides instant market access and deposit base integration, which is crucial when loan growth outpaces deposit growth, pushing the loan-to-deposit ratio to 105% at the end of Q2 2025.
Focusing marketing spend on attracting new deposit relationships in existing markets is necessary to manage that loan-to-deposit ratio and fund future growth organically. The bank is already executing on this, as Q2 2025 saw deposit growth fueled by gains in the noninterest-bearing category, which increased to comprise 18.6% of total deposits. The Q1 2025 strategy included targeted promotions to drive engagement with newly opened branches.
Key deposit initiatives to support loan growth include:
- Attracting new deposit relationships amid industry-wide pricing competition.
- Growing noninterest-bearing balances, which increased in Q1 2025.
- Implementing CD promotions to strategically onboard funding.
- Maintaining a strong efficiency ratio, which was below 60% for the 23rd consecutive quarter in Q1 2025.
To fund the significant loan growth seen across Q1 2025 ($91.8 million) and Q2 2025 ($91.2 million annualized), the bank also secured $35.0 million in subordinated notes in June 2025 at a 7.125% fixed rate for five years.
Finance: draft Q4 2025 deposit growth target by Friday.
First Bank (FRBA) - Ansoff Matrix: Product Development
You're looking at how First Bank (FRBA) can grow by introducing new products into its existing commercial and retail markets. This is the Product Development quadrant of the Ansoff Matrix, which relies on your current market footprint but demands significant investment in new offerings. Given that First Bank's total loans stood at $3.24 billion at the end of Q1 2025, growing to $3.37 billion by Q3 2025, expanding the product suite is a logical next step to drive fee income, which was $2.0 million in Q1 2025 and reached $2.4 million in Q3 2025.
The first key initiative is digitizing a specific lending niche. Launch a specialized digital lending platform for small business (SBA) loans, building on the existing $91 million portfolio. The broader digital lending platform market is projected to hit $13.8 billion in 2025 and is growing at a CAGR of 26.53% through 2034, so building a proprietary platform positions First Bank to capture a piece of that growth, especially since the SBA announced streamlining initiatives in 2025.
Next, you need to capture more wallet share from your successful commercial clients. Introduce a high-net-worth wealth management service. To benchmark the scale, industry examples targeting HNWI clients often look for an average AUM of around €3 million per client. This service directly targets C&I clients, a segment that contributed to First Bank's strong loan growth, which was 11.8% annualized in Q1 2025.
To enhance non-interest income, develop a proprietary treasury management system for middle-market commercial clients. This is a critical move, as banks over $3 billion in assets are increasingly adopting these systems for competitive reasons. The value proposition here is substantial; for every $1 in explicit fee income generated by treasury services, the resulting low-cost deposits can create a multiplier effect of $4 or $5 in overall relationship value, widening net interest margins.
A green-lending product line for commercial real estate (CRE) is also on the table. This aligns with a major market trend, as global sustainable lending grew over 5200% between 2016 and 2021. Furthermore, overall CRE lending activity surged 90% year-over-year in Q1 2025, showing strong demand for financing in the sector. Offering energy-efficient building financing taps into this momentum while meeting growing ESG criteria integration in lending decisions for 2025.
Finally, to attract larger commercial non-interest-bearing balances, create a premium, tiered money market account. This directly addresses the need to secure low-cost funding, which is essential for maintaining profitability, especially as the efficiency ratio was already strong at 51.81% in Q3 2025. Attracting non-interest-bearing deposits helps offset funding costs and supports loan growth, which saw total loans reach $3.37 billion by Q3 2025.
Here is a summary of the product development focus areas and relevant financial context:
| Product Initiative | Existing Portfolio/Market Context | Relevant Financial Metric (First Bank 2025) |
|---|---|---|
| Specialized Digital SBA Lending Platform | Digital Lending Platform Market CAGR: 21.4% (2024-2029) | Existing SBA Portfolio: $91 million (as provided) |
| High-Net-Worth Wealth Management Service | Targeting HNWI clients (Avg AUM proxy: €3M) | C&I Loan Growth Contributor; Total Loans: $3.24 billion (Q1 2025) |
| Proprietary Treasury Management System | Potential Fee Income Multiplier: $4 or $5 per $1 fee | Q1 2025 Non-Interest Income: $2.0 million |
| Green-Lending Product Line (CRE) | Sustainable Lending Growth: Over 5200% (2016-2021) | CRE Lending Activity Surge: 90% YoY (Q1 2025) |
| Premium Tiered Money Market Account | Focus on low-cost deposit generation | Efficiency Ratio: 51.81% (Q3 2025) |
You should prioritize the development of the Treasury Management System first, as it directly feeds the low-cost deposit base needed to fund the growth in the C&I and CRE portfolios, which are already showing strong organic momentum. The bank's ability to maintain an efficiency ratio below 60% for 23 consecutive quarters shows operational discipline to support these new product builds.
The next step is to assign a cross-functional team to scope the technology integration for the treasury management system by the end of the quarter.
First Bank (FRBA) - Ansoff Matrix: Diversification
You're looking at growth outside the established New Jersey, Pennsylvania, and Florida footprint, which is the classic Diversification quadrant. This means new products in new markets, or new markets with existing products, which carries the highest risk but potentially the highest reward. Let's map the potential scale of these moves using current market data.
Acquire a niche financial technology (FinTech) firm specializing in payments or blockchain for commercial clients.
Acquiring a payments-focused FinTech means entering a segment where valuations are active. For Payment Solutions companies with revenue between $6-10 million, the median EV/Revenue multiple in 2025 was reported at 5.6x. If the target is larger, in the $10-30 million revenue bracket, that multiple shifts to 6.7x. For a blockchain specialist, the EV/Revenue multiple range observed in 2025 was wider, from 2.5x up to 15.2x, depending heavily on the specific application and stickiness of the commercial contracts. This contrasts with First Bank (FRBA)'s Q3 2025 efficiency ratio of 51.81%, suggesting any acquisition must be integrated efficiently to avoid margin erosion.
Enter the specialized lending market, such as healthcare or equipment leasing, outside the core NJ/PA/FL corridor.
The specialized lending space offers significant scale. The U.S. Medical Equipment Financing Market size in 2024 was valued at $37.64 billion, with a projected Compound Annual Growth Rate (CAGR) of 8.10% from 2025 to 2034. Focusing specifically on leasing, the Healthcare Equipment Leasing Market size stands at $129.83 billion in 2025, with a forecast to reach $267.56 billion by 2030, showing a strong 15.56% CAGR. This compares to First Bank (FRBA)'s total loan portfolio of $3.37 billion as of September 30, 2025. The leasing segment shows operating leases held 64.32% of 2024 demand.
Establish a non-bank subsidiary to offer insurance or brokerage services to existing commercial customers.
Cross-selling insurance services taps into a large, established market. The United States Commercial Insurance Market size was $294.6 Billion in 2024, with an expected CAGR of 5.20% through 2033. For brokerage specifically, the U.S. Insurance Brokerage Market size was estimated at $65.30 billion in 2024, projected to grow at a 3.80% CAGR to reach $94.82 billion by 2034. Retail brokerage held 61.1% of the U.S. insurance brokerage market share in 2024. This could augment First Bank (FRBA)'s Q3 2025 Net Interest Margin of 3.71% with non-interest income streams.
Invest in a national digital-only bank brand focused on a specific demographic or industry segment.
A national digital brand targets a different customer acquisition model. Digital-only banks are projected to serve 50 million U.S. customers by the end of 2025. The global neobanking market is expected to reach $262.36 billion by the end of 2025. To put customer preference in context, 80% of millennials indicated they prefer digital banking in 2025. This strategy leverages digital adoption, contrasting with First Bank (FRBA)'s reported 26 full-service branches across NJ, PA, and FL.
Target a new geographic market, like the Carolinas, with a full suite of commercial and retail products via acquisition.
Entering the Carolinas means entering a market with established banking activity. The Commercial Banking industry market size in North Carolina alone is estimated at $68.0 billion in 2025. This North Carolina market has shown an average annual growth rate of 7.1% from 2020 to 2025. For context on scale, First Bank (FRBA)'s Total Assets as of December 31, 2024, were $3.78 billion. The FDIC reported 39 institutions in North Carolina as of Q2-25.
Here's a comparison of the market sizes for potential diversification avenues:
| Market Segment | Metric | Value (2025 or Latest) | Growth Rate/Multiple |
| FinTech Payments Acquisition | EV/Revenue Multiple (Mid-size) | 6.7x | N/A (Multiple) |
| Healthcare Equipment Leasing | Market Size | $129.83 billion | 15.56% CAGR (to 2030) |
| Commercial Insurance Brokerage | Market Size | $140.38 billion | 5.20% CAGR (Commercial Insurance to 2033) |
| Digital-Only Bank Target | Projected US Customers | 50 million | N/A (Customer Count) |
| New Geographic Market (NC) | Commercial Banking Market Size | $68.0 billion | 7.1% Annual Growth (2020-2025) |
Key First Bank (FRBA) Financial Benchmarks (as of September 30, 2025):
- Net Income (Q3 2025): $11.7 million
- Total Loans: $3.37 billion
- Total Deposits: $3.22 billion
- Tangible Book Value per Share: $15.33
- Return on Average Assets (Q3 2025): 1.16%
For the full year 2024, First Bank (FRBA) reported Net Income of $42.2 million on Total Assets of $3.78 billion as of December 31, 2024.
Disclaimer
All information, articles, and product details provided on this website are for general informational and educational purposes only. We do not claim any ownership over, nor do we intend to infringe upon, any trademarks, copyrights, logos, brand names, or other intellectual property mentioned or depicted on this site. Such intellectual property remains the property of its respective owners, and any references here are made solely for identification or informational purposes, without implying any affiliation, endorsement, or partnership.
We make no representations or warranties, express or implied, regarding the accuracy, completeness, or suitability of any content or products presented. Nothing on this website should be construed as legal, tax, investment, financial, medical, or other professional advice. In addition, no part of this site—including articles or product references—constitutes a solicitation, recommendation, endorsement, advertisement, or offer to buy or sell any securities, franchises, or other financial instruments, particularly in jurisdictions where such activity would be unlawful.
All content is of a general nature and may not address the specific circumstances of any individual or entity. It is not a substitute for professional advice or services. Any actions you take based on the information provided here are strictly at your own risk. You accept full responsibility for any decisions or outcomes arising from your use of this website and agree to release us from any liability in connection with your use of, or reliance upon, the content or products found herein.