
|
Valeo SE (FR.PA) DCF Valuation |
Fully Editable: Tailor To Your Needs In Excel Or Sheets
Professional Design: Trusted, Industry-Standard Templates
Investor-Approved Valuation Models
MAC/PC Compatible, Fully Unlocked
No Expertise Is Needed; Easy To Follow
Valeo SE (FR.PA) Bundle
Streamline Valeo SE (FRPA) valuation with this customizable DCF Calculator! With real Valeo SE (FRPA) financials and adjustable forecast inputs, you can explore various scenarios and determine Valeo SE (FRPA) fair value in just minutes.
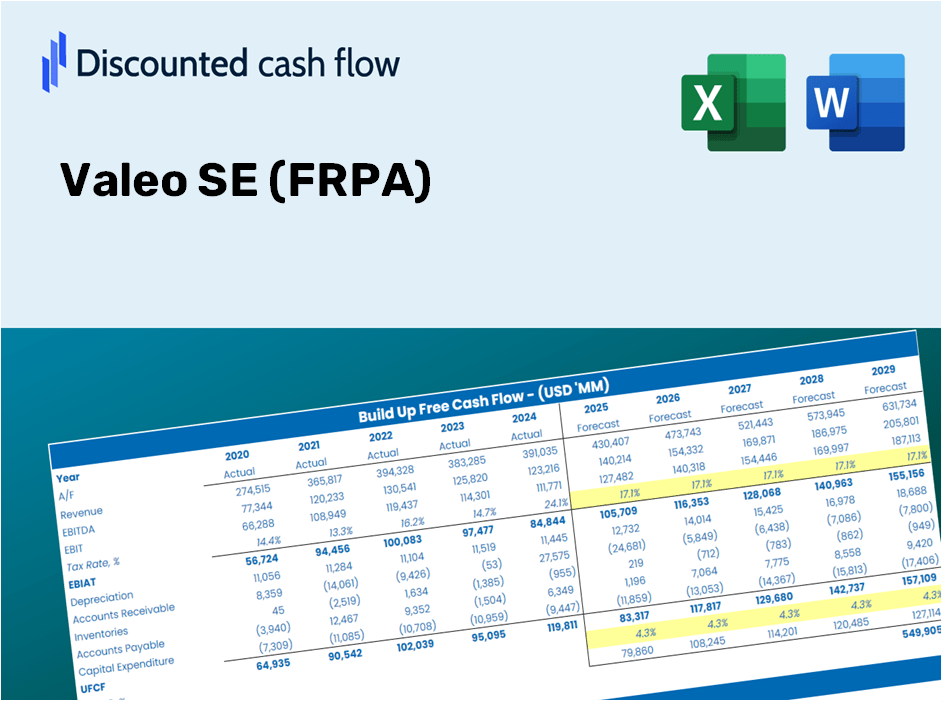
Discounted Cash Flow (DCF) - (USD MM)
| Year | AY1 2020 |
AY2 2021 |
AY3 2022 |
AY4 2023 |
AY5 2024 |
FY1 2025 |
FY2 2026 |
FY3 2027 |
FY4 2028 |
FY5 2029 |
|---|---|---|---|---|---|---|---|---|---|---|
| Revenue | 16,436.0 | 17,262.0 | 20,037.0 | 22,044.0 | 21,492.0 | 21,921.5 | 22,359.6 | 22,806.4 | 23,262.2 | 23,727.1 |
| Revenue Growth, % | 0 | 5.03 | 16.08 | 10.02 | -2.5 | 2 | 2 | 2 | 2 | 2 |
| EBITDA | 979.0 | 2,362.0 | 2,351.0 | 2,552.0 | 2,627.0 | 2,418.9 | 2,467.3 | 2,516.6 | 2,566.9 | 2,618.2 |
| EBITDA, % | 5.96 | 13.68 | 11.73 | 11.58 | 12.22 | 11.03 | 11.03 | 11.03 | 11.03 | 11.03 |
| Depreciation | 1,580.0 | 1,614.0 | 1,818.0 | 1,835.0 | 1,989.0 | 1,999.9 | 2,039.9 | 2,080.6 | 2,122.2 | 2,164.6 |
| Depreciation, % | 9.61 | 9.35 | 9.07 | 8.32 | 9.25 | 9.12 | 9.12 | 9.12 | 9.12 | 9.12 |
| EBIT | -601.0 | 748.0 | 533.0 | 717.0 | 638.0 | 419.0 | 427.4 | 436.0 | 444.7 | 453.6 |
| EBIT, % | -3.66 | 4.33 | 2.66 | 3.25 | 2.97 | 1.91 | 1.91 | 1.91 | 1.91 | 1.91 |
| Total Cash | 3,049.0 | 2,485.0 | 3,414.0 | 3,137.0 | 3,153.0 | 3,458.6 | 3,527.7 | 3,598.2 | 3,670.1 | 3,743.5 |
| Total Cash, percent | .0 | .0 | .0 | .0 | .0 | .0 | .0 | .0 | .0 | .0 |
| Account Receivables | 2,676.0 | 3,068.0 | 3,618.0 | 2,734.0 | 3,419.0 | 3,525.9 | 3,596.4 | 3,668.3 | 3,741.6 | 3,816.4 |
| Account Receivables, % | 16.28 | 17.77 | 18.06 | 12.4 | 15.91 | 16.08 | 16.08 | 16.08 | 16.08 | 16.08 |
| Inventories | 1,582.0 | 1,990.0 | 2,383.0 | 2,365.0 | 2,110.0 | 2,349.7 | 2,396.6 | 2,444.5 | 2,493.4 | 2,543.2 |
| Inventories, % | 9.63 | 11.53 | 11.89 | 10.73 | 9.82 | 10.72 | 10.72 | 10.72 | 10.72 | 10.72 |
| Accounts Payable | 4,697.0 | 4,633.0 | 5,586.0 | 5,449.0 | 5,382.0 | 5,833.6 | 5,950.2 | 6,069.1 | 6,190.4 | 6,314.1 |
| Accounts Payable, % | 28.58 | 26.84 | 27.88 | 24.72 | 25.04 | 26.61 | 26.61 | 26.61 | 26.61 | 26.61 |
| Capital Expenditure | -1,478.0 | -1,350.0 | -1,489.0 | -2,001.0 | -2,224.0 | -1,914.6 | -1,952.9 | -1,991.9 | -2,031.7 | -2,072.3 |
| Capital Expenditure, % | -8.99 | -7.82 | -7.43 | -9.08 | -10.35 | -8.73 | -8.73 | -8.73 | -8.73 | -8.73 |
| Tax Rate, % | 51.35 | 51.35 | 51.35 | 51.35 | 51.35 | 51.35 | 51.35 | 51.35 | 51.35 | 51.35 |
| EBITAT | -924.4 | 206.5 | 351.3 | 412.6 | 310.4 | 251.2 | 256.2 | 261.3 | 266.5 | 271.9 |
| Depreciation | ||||||||||
| Changes in Account Receivables | ||||||||||
| Changes in Inventories | ||||||||||
| Changes in Accounts Payable | ||||||||||
| Capital Expenditure | ||||||||||
| UFCF | -383.4 | -393.5 | 690.3 | 1,011.6 | -421.6 | 441.5 | 342.4 | 349.2 | 356.2 | 363.3 |
| WACC, % | 6.37 | 3.71 | 5.12 | 4.81 | 4.48 | 4.9 | 4.9 | 4.9 | 4.9 | 4.9 |
| PV UFCF | ||||||||||
| SUM PV UFCF | 1,614.7 | |||||||||
| Long Term Growth Rate, % | 3.20 | |||||||||
| Free cash flow (T + 1) | 375 | |||||||||
| Terminal Value | 22,065 | |||||||||
| Present Terminal Value | 17,372 | |||||||||
| Enterprise Value | 18,987 | |||||||||
| Net Debt | 3,884 | |||||||||
| Equity Value | 15,103 | |||||||||
| Diluted Shares Outstanding, MM | 245 | |||||||||
| Equity Value Per Share | 61.74 |
What You Will Receive
- Authentic Valeo Data: Preloaded financial information – covering everything from revenue to EBIT – based on both actual and anticipated figures.
- Comprehensive Customization: Modify all essential parameters (yellow cells) including WACC, growth percentage, and tax rates.
- Instant Valuation Refresh: Automatic recalculations to assess how changes affect Valeo’s fair value.
- Flexible Excel Template: Designed for quick modifications, scenario analysis, and thorough projections.
- Efficient and Accurate: Avoid the hassle of building models from the ground up while ensuring precision and adaptability.
Key Features
- Authentic Valeo Financials: Gain access to precise pre-loaded historical figures and future forecasts.
- Tailored Forecast Parameters: Modify yellow-highlighted fields including WACC, growth rates, and profit margins.
- Real-Time Calculations: Automatic updates for DCF, Net Present Value (NPV), and cash flow assessments.
- Interactive Dashboard: User-friendly charts and summaries to help you visualize valuation outcomes.
- Designed for All Experience Levels: An easy-to-navigate layout suitable for investors, CFOs, and consultants alike.
How It Functions
- Step 1: Download the Excel file.
- Step 2: Examine the pre-filled Valeo SE (FRPA) data (historical and projected).
- Step 3: Modify key assumptions (highlighted in yellow) based on your insights.
- Step 4: Observe automatic recalibrations for Valeo SE's intrinsic value.
- Step 5: Utilize the results for investment choices or reporting purposes.
Reasons to Choose This Calculator for Valeo SE (FRPA)
- Precision: Leveraging real Valeo financial data for reliable results.
- Adaptability: Allows users to easily test and adjust parameters as needed.
- Efficiency: Eliminate the complexities of creating a DCF model from the ground up.
- Expert Quality: Crafted with the accuracy and functionality expected at the CFO level.
- Intuitive Design: Simple to navigate, making it accessible for users without deep financial modeling skills.
Who Should Use This Product?
- Investors: Assess Valeo SE’s valuation prior to making stock transactions.
- CFOs and Financial Analysts: Optimize valuation processes and evaluate financial projections.
- Startup Founders: Understand the valuation methods applied to large public firms like Valeo SE (FRPA).
- Consultants: Provide comprehensive valuation reports to clients based on industry standards.
- Students and Educators: Utilize actual market data to practice and teach valuation methodologies.
Contents of the Template
- Comprehensive DCF Model: An editable template featuring thorough valuation calculations.
- Real-World Data: Valeo SE’s historical and projected financials preloaded for in-depth analysis.
- Customizable Parameters: Modify WACC, growth rates, and tax assumptions to explore various scenarios.
- Financial Statements: Complete annual and quarterly breakdowns for enhanced insights.
- Key Ratios: Integrated analysis for profitability, efficiency, and leverage metrics.
- Dashboard with Visual Outputs: Charts and tables that provide clear, actionable results.
Disclaimer
All information, articles, and product details provided on this website are for general informational and educational purposes only. We do not claim any ownership over, nor do we intend to infringe upon, any trademarks, copyrights, logos, brand names, or other intellectual property mentioned or depicted on this site. Such intellectual property remains the property of its respective owners, and any references here are made solely for identification or informational purposes, without implying any affiliation, endorsement, or partnership.
We make no representations or warranties, express or implied, regarding the accuracy, completeness, or suitability of any content or products presented. Nothing on this website should be construed as legal, tax, investment, financial, medical, or other professional advice. In addition, no part of this site—including articles or product references—constitutes a solicitation, recommendation, endorsement, advertisement, or offer to buy or sell any securities, franchises, or other financial instruments, particularly in jurisdictions where such activity would be unlawful.
All content is of a general nature and may not address the specific circumstances of any individual or entity. It is not a substitute for professional advice or services. Any actions you take based on the information provided here are strictly at your own risk. You accept full responsibility for any decisions or outcomes arising from your use of this website and agree to release us from any liability in connection with your use of, or reliance upon, the content or products found herein.