
|
Flexible Solutions International, Inc. (FSI) DCF Valuation |
Fully Editable: Tailor To Your Needs In Excel Or Sheets
Professional Design: Trusted, Industry-Standard Templates
Investor-Approved Valuation Models
MAC/PC Compatible, Fully Unlocked
No Expertise Is Needed; Easy To Follow
Flexible Solutions International, Inc. (FSI) Bundle
Evaluate Flexible Solutions International, Inc.'s (FSI) financial outlook like a professional! This (FSI) DCF Calculator offers pre-filled financial data and full flexibility to modify revenue growth, WACC, margins, and other crucial assumptions to align with your projections.
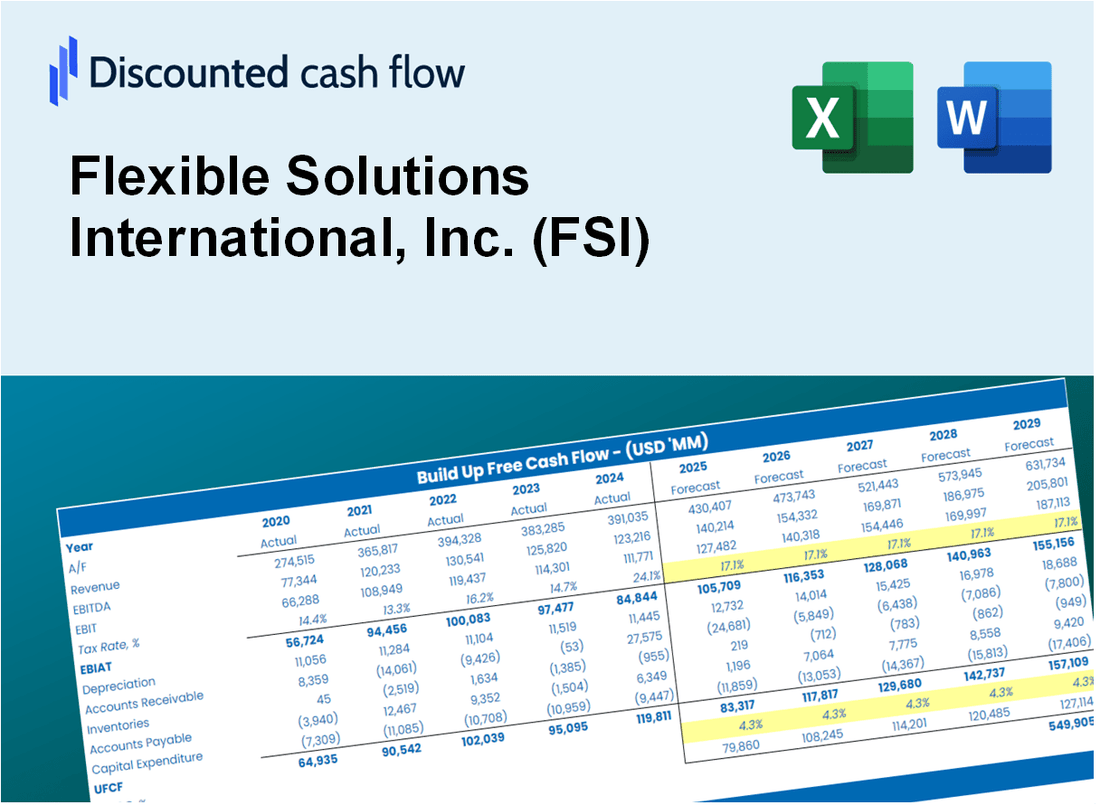
Discounted Cash Flow (DCF) - (USD MM)
| Year | AY1 2020 |
AY2 2021 |
AY3 2022 |
AY4 2023 |
AY5 2024 |
FY1 2025 |
FY2 2026 |
FY3 2027 |
FY4 2028 |
FY5 2029 |
|---|---|---|---|---|---|---|---|---|---|---|
| Revenue | 31.4 | 34.4 | 45.8 | 38.3 | 38.2 | 40.7 | 43.4 | 46.2 | 49.3 | 52.5 |
| Revenue Growth, % | 0 | 9.58 | 33.19 | -16.4 | -0.23469 | 6.54 | 6.54 | 6.54 | 6.54 | 6.54 |
| EBITDA | 6.6 | 8.1 | 9.5 | 5.9 | 5.5 | 7.7 | 8.2 | 8.8 | 9.4 | 10.0 |
| EBITDA, % | 21.13 | 23.48 | 20.68 | 15.29 | 14.43 | 19 | 19 | 19 | 19 | 19 |
| Depreciation | 1.2 | 1.2 | 1.3 | 1.7 | .0 | 1.2 | 1.3 | 1.4 | 1.4 | 1.5 |
| Depreciation, % | 3.77 | 3.58 | 2.9 | 4.54 | -0.12465 | 2.93 | 2.93 | 2.93 | 2.93 | 2.93 |
| EBIT | 5.5 | 6.9 | 8.2 | 4.1 | 5.6 | 6.5 | 7.0 | 7.4 | 7.9 | 8.4 |
| EBIT, % | 17.36 | 19.91 | 17.78 | 10.76 | 14.55 | 16.07 | 16.07 | 16.07 | 16.07 | 16.07 |
| Total Cash | 4.5 | 6.7 | 6.8 | 7.7 | 10.0 | 7.7 | 8.2 | 8.8 | 9.4 | 10.0 |
| Total Cash, percent | .0 | .0 | .0 | .0 | .0 | .0 | .0 | .0 | .0 | .0 |
| Account Receivables | 5.9 | 7.1 | 9.4 | 9.8 | 11.7 | 9.5 | 10.1 | 10.8 | 11.5 | 12.2 |
| Account Receivables, % | 18.75 | 20.71 | 20.61 | 25.68 | 30.59 | 23.27 | 23.27 | 23.27 | 23.27 | 23.27 |
| Inventories | 8.4 | 9.5 | 14.4 | 11.1 | 10.9 | 11.7 | 12.4 | 13.2 | 14.1 | 15.0 |
| Inventories, % | 26.66 | 27.61 | 31.46 | 29.05 | 28.48 | 28.65 | 28.65 | 28.65 | 28.65 | 28.65 |
| Accounts Payable | .6 | 1.3 | .9 | 2.0 | 2.0 | 1.5 | 1.6 | 1.7 | 1.8 | 1.9 |
| Accounts Payable, % | 1.78 | 3.73 | 1.91 | 5.18 | 5.36 | 3.59 | 3.59 | 3.59 | 3.59 | 3.59 |
| Capital Expenditure | -1.1 | -.8 | -2.0 | -5.0 | -5.0 | -2.9 | -3.1 | -3.3 | -3.5 | -3.8 |
| Capital Expenditure, % | -3.41 | -2.27 | -4.32 | -13.02 | -12.98 | -7.2 | -7.2 | -7.2 | -7.2 | -7.2 |
| Tax Rate, % | 38.65 | 38.65 | 38.65 | 38.65 | 38.65 | 38.65 | 38.65 | 38.65 | 38.65 | 38.65 |
| EBITAT | 3.1 | 3.6 | 7.3 | 3.2 | 3.4 | 4.4 | 4.7 | 5.0 | 5.3 | 5.7 |
| Depreciation | ||||||||||
| Changes in Account Receivables | ||||||||||
| Changes in Inventories | ||||||||||
| Changes in Accounts Payable | ||||||||||
| Capital Expenditure | ||||||||||
| UFCF | -10.5 | 2.4 | -1.0 | 3.9 | -3.1 | 3.5 | 1.6 | 1.7 | 1.8 | 1.9 |
| WACC, % | 10.27 | 10.24 | 10.44 | 10.37 | 10.29 | 10.32 | 10.32 | 10.32 | 10.32 | 10.32 |
| PV UFCF | ||||||||||
| SUM PV UFCF | 8.0 | |||||||||
| Long Term Growth Rate, % | 1.00 | |||||||||
| Free cash flow (T + 1) | 2 | |||||||||
| Terminal Value | 20 | |||||||||
| Present Terminal Value | 12 | |||||||||
| Enterprise Value | 20 | |||||||||
| Net Debt | 3 | |||||||||
| Equity Value | 17 | |||||||||
| Diluted Shares Outstanding, MM | 13 | |||||||||
| Equity Value Per Share | 1.36 |
What You Will Get
- Real FSI Financial Data: Pre-filled with Flexible Solutions International’s historical and projected data for precise analysis.
- Fully Editable Template: Modify key inputs like revenue growth, WACC, and EBITDA % with ease.
- Automatic Calculations: See FSI’s intrinsic value update instantly based on your changes.
- Professional Valuation Tool: Designed for investors, analysts, and consultants seeking accurate DCF results.
- User-Friendly Design: Simple structure and clear instructions for all experience levels.
Key Features
- Comprehensive Data: Flexible Solutions International’s historical financial records and pre-filled projections.
- Customizable Inputs: Modify WACC, tax rates, revenue growth, and EBITDA margins as needed.
- Real-Time Insights: Observe the intrinsic value of Flexible Solutions International recalculating instantly.
- Intuitive Visual Outputs: Dashboard graphs showcase valuation outcomes and essential metrics.
- Designed for Precision: A professional-grade tool for analysts, investors, and finance professionals.
How It Works
- 1. Access the Template: Download and open the Excel file containing Flexible Solutions International, Inc. (FSI)'s preloaded data.
- 2. Modify Assumptions: Adjust key inputs such as growth rates, WACC, and capital expenditures.
- 3. View Results in Real-Time: The DCF model automatically computes intrinsic value and NPV.
- 4. Explore Scenarios: Evaluate various forecasts to understand different valuation scenarios.
- 5. Present with Assurance: Deliver professional valuation insights to back your strategic decisions.
Why Choose Flexible Solutions International, Inc. (FSI) Calculator?
- All-in-One Solution: Combines DCF, WACC, and financial ratio analyses for comprehensive evaluations.
- Adjustable Parameters: Modify the highlighted cells to explore a variety of financial scenarios.
- In-Depth Analysis: Automatically computes FSI’s intrinsic value and Net Present Value for informed decisions.
- Integrated Data: Features historical and projected data for reliable baseline assessments.
- Expert-Level Tool: Perfect for financial analysts, investors, and business advisors looking for precision.
Who Should Use This Product?
- Individual Investors: Gain insights for making informed decisions about investing in Flexible Solutions International, Inc. (FSI).
- Financial Analysts: Enhance valuation methodologies with comprehensive financial models tailored for FSI.
- Consultants: Provide clients with expert valuation analyses and recommendations related to FSI.
- Business Owners: Learn from FSI's valuation to inform your own business strategies and decisions.
- Finance Students: Explore practical valuation techniques using data and case studies from FSI.
What the Template Contains
- Operating and Balance Sheet Data: Pre-filled Flexible Solutions International, Inc. (FSI) historical data and forecasts, including revenue, EBITDA, EBIT, and capital expenditures.
- WACC Calculation: A dedicated sheet for Weighted Average Cost of Capital (WACC), including parameters like Beta, risk-free rate, and share price.
- DCF Valuation (Unlevered and Levered): Editable Discounted Cash Flow models showing intrinsic value with detailed calculations.
- Financial Statements: Pre-loaded financial statements (annual and quarterly) to support analysis.
- Key Ratios: Includes profitability, leverage, and efficiency ratios for Flexible Solutions International, Inc. (FSI).
- Dashboard and Charts: Visual summary of valuation outputs and assumptions to analyze results easily.
Disclaimer
All information, articles, and product details provided on this website are for general informational and educational purposes only. We do not claim any ownership over, nor do we intend to infringe upon, any trademarks, copyrights, logos, brand names, or other intellectual property mentioned or depicted on this site. Such intellectual property remains the property of its respective owners, and any references here are made solely for identification or informational purposes, without implying any affiliation, endorsement, or partnership.
We make no representations or warranties, express or implied, regarding the accuracy, completeness, or suitability of any content or products presented. Nothing on this website should be construed as legal, tax, investment, financial, medical, or other professional advice. In addition, no part of this site—including articles or product references—constitutes a solicitation, recommendation, endorsement, advertisement, or offer to buy or sell any securities, franchises, or other financial instruments, particularly in jurisdictions where such activity would be unlawful.
All content is of a general nature and may not address the specific circumstances of any individual or entity. It is not a substitute for professional advice or services. Any actions you take based on the information provided here are strictly at your own risk. You accept full responsibility for any decisions or outcomes arising from your use of this website and agree to release us from any liability in connection with your use of, or reliance upon, the content or products found herein.