
|
Ramsay Générale de Santé SA (GDS.PA) DCF Valuation |
Fully Editable: Tailor To Your Needs In Excel Or Sheets
Professional Design: Trusted, Industry-Standard Templates
Investor-Approved Valuation Models
MAC/PC Compatible, Fully Unlocked
No Expertise Is Needed; Easy To Follow
Ramsay Générale de Santé SA (GDS.PA) Bundle
Explore the financial prospects of Ramsay Générale de Santé SA with our user-friendly DCF Calculator! Enter your assumptions for growth, margins, and costs to calculate the intrinsic value of Ramsay Générale de Santé SA (GDSPA) and enhance your investment strategy.
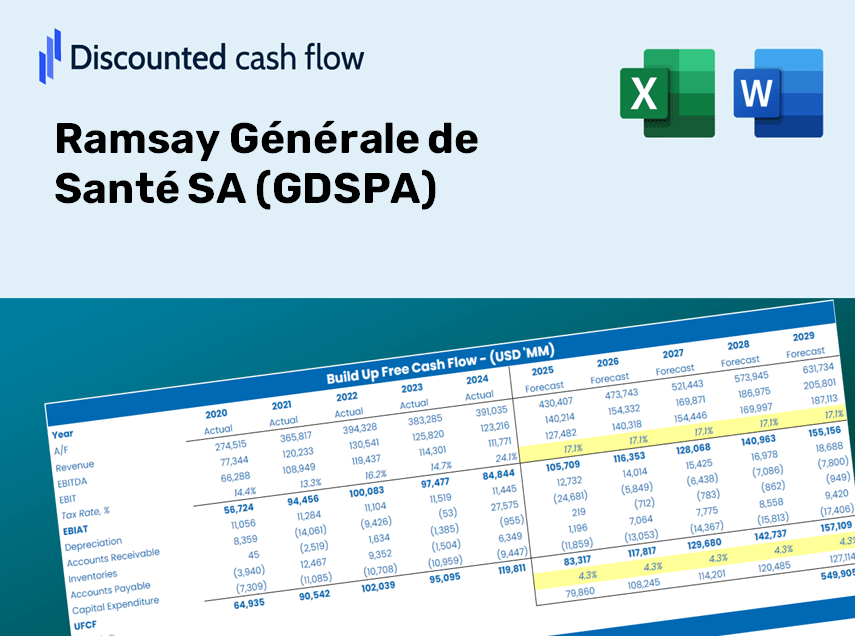
Discounted Cash Flow (DCF) - (USD MM)
| Year | AY1 2020 |
AY2 2021 |
AY3 2022 |
AY4 2023 |
AY5 2024 |
FY1 2025 |
FY2 2026 |
FY3 2027 |
FY4 2028 |
FY5 2029 |
|---|---|---|---|---|---|---|---|---|---|---|
| Revenue | 4,022.6 | 4,301.0 | 4,701.5 | 5,006.5 | 5,242.0 | 5,515.9 | 5,804.2 | 6,107.5 | 6,426.6 | 6,762.4 |
| Revenue Growth, % | 0 | 6.92 | 9.31 | 6.49 | 4.7 | 5.23 | 5.23 | 5.23 | 5.23 | 5.23 |
| EBITDA | 604.0 | 691.0 | 656.3 | 591.3 | 599.7 | 753.4 | 792.7 | 834.2 | 877.8 | 923.6 |
| EBITDA, % | 15.02 | 16.07 | 13.96 | 11.81 | 11.44 | 13.66 | 13.66 | 13.66 | 13.66 | 13.66 |
| Depreciation | 371.8 | 377.3 | 403.2 | 426.7 | 434.0 | 478.7 | 503.7 | 530.0 | 557.7 | 586.9 |
| Depreciation, % | 9.24 | 8.77 | 8.58 | 8.52 | 8.28 | 8.68 | 8.68 | 8.68 | 8.68 | 8.68 |
| EBIT | 232.2 | 313.7 | 253.1 | 164.6 | 165.7 | 274.7 | 289.0 | 304.1 | 320.0 | 336.7 |
| EBIT, % | 5.77 | 7.29 | 5.38 | 3.29 | 3.16 | 4.98 | 4.98 | 4.98 | 4.98 | 4.98 |
| Total Cash | 620.0 | 143.5 | 362.9 | 381.3 | 384.0 | 456.8 | 480.7 | 505.8 | 532.2 | 560.1 |
| Total Cash, percent | .0 | .0 | .0 | .0 | .0 | .0 | .0 | .0 | .0 | .0 |
| Account Receivables | 331.0 | 426.7 | 556.1 | 687.2 | 527.5 | 593.1 | 624.1 | 656.8 | 691.1 | 727.2 |
| Account Receivables, % | 8.23 | 9.92 | 11.83 | 13.73 | 10.06 | 10.75 | 10.75 | 10.75 | 10.75 | 10.75 |
| Inventories | 111.4 | 111.2 | 118.2 | 125.0 | 125.1 | 140.7 | 148.0 | 155.8 | 163.9 | 172.5 |
| Inventories, % | 2.77 | 2.59 | 2.51 | 2.5 | 2.39 | 2.55 | 2.55 | 2.55 | 2.55 | 2.55 |
| Accounts Payable | 343.8 | 410.8 | 471.9 | 457.8 | 432.3 | 502.2 | 528.5 | 556.1 | 585.2 | 615.7 |
| Accounts Payable, % | 8.55 | 9.55 | 10.04 | 9.14 | 8.25 | 9.11 | 9.11 | 9.11 | 9.11 | 9.11 |
| Capital Expenditure | -176.4 | -193.6 | -172.2 | -168.5 | -142.8 | -205.6 | -216.4 | -227.7 | -239.6 | -252.1 |
| Capital Expenditure, % | -4.39 | -4.5 | -3.66 | -3.37 | -2.72 | -3.73 | -3.73 | -3.73 | -3.73 | -3.73 |
| Tax Rate, % | -61.98 | -61.98 | -61.98 | -61.98 | -61.98 | -61.98 | -61.98 | -61.98 | -61.98 | -61.98 |
| EBITAT | 146.1 | 200.6 | 142.7 | 217.4 | 268.4 | 210.5 | 221.5 | 233.1 | 245.3 | 258.1 |
| Depreciation | ||||||||||
| Changes in Account Receivables | ||||||||||
| Changes in Inventories | ||||||||||
| Changes in Accounts Payable | ||||||||||
| Capital Expenditure | ||||||||||
| UFCF | 242.9 | 355.8 | 298.4 | 323.6 | 693.7 | 472.3 | 496.8 | 522.8 | 550.1 | 578.8 |
| WACC, % | 3.58 | 3.62 | 3.3 | 5.14 | 5.14 | 4.16 | 4.16 | 4.16 | 4.16 | 4.16 |
| PV UFCF | ||||||||||
| SUM PV UFCF | 2,313.6 | |||||||||
| Long Term Growth Rate, % | 2.00 | |||||||||
| Free cash flow (T + 1) | 590 | |||||||||
| Terminal Value | 27,385 | |||||||||
| Present Terminal Value | 22,340 | |||||||||
| Enterprise Value | 24,654 | |||||||||
| Net Debt | 3,717 | |||||||||
| Equity Value | 20,937 | |||||||||
| Diluted Shares Outstanding, MM | 110 | |||||||||
| Equity Value Per Share | 189.72 |
What You'll Receive
- Pre-Filled Financial Model: Utilize Ramsay Générale de Santé SA's (GDSPA) actual financial data for accurate DCF valuation.
- Comprehensive Forecast Control: Customize revenue growth, profit margins, WACC, and other essential variables.
- Real-Time Calculations: Immediate updates let you view results as you modify inputs.
- Professional-Grade Template: An expertly crafted Excel file ready for investor presentations.
- Flexible and Reusable: Designed for adaptability, suitable for multiple in-depth forecasts.
Key Features
- Authentic Ramsay Financials: Gain access to reliable pre-loaded historical data and future forecasts.
- Adjustable Forecast Parameters: Modify highlighted cells such as WACC, growth rates, and profit margins.
- Real-Time Calculations: Automatic refresh of DCF, Net Present Value (NPV), and cash flow assessments.
- User-Friendly Dashboard: Intuitive charts and summaries for clear visualization of your valuation insights.
- Suitable for All Levels: A straightforward and intuitive layout tailored for investors, CFOs, and consultants.
How It Functions
- 1. Access the Template: Download and open the Excel file containing Ramsay Générale de Santé SA's (GDSPA) preloaded data.
- 2. Adjust Inputs: Modify essential parameters such as growth rates, WACC, and capital expenditures.
- 3. View Results in Real-Time: The DCF model automatically calculates the intrinsic value and NPV.
- 4. Explore Scenarios: Analyze various forecasts to evaluate different valuation scenarios.
- 5. Present with Assurance: Share professional valuation insights to bolster your decision-making process.
Why Opt for This Calculator?
- Designed for Experts: A sophisticated tool tailored for analysts, CFOs, and consultants.
- Accurate Data: Historical and projected financials for Ramsay Générale de Santé SA (GDSPA) preloaded for precision.
- Scenario Simulation: Easily test various forecasts and assumptions.
- Transparent Results: Automatically computes intrinsic value, NPV, and essential metrics.
- User-Friendly: Step-by-step guidance to help you navigate the process effortlessly.
Who Can Benefit from This Product?
- Institutional Investors: Develop comprehensive and trustworthy valuation models for portfolio assessment.
- Financial Analysis Teams: Evaluate valuation scenarios to inform corporate strategies.
- Advisors and Consultants: Deliver precise valuation insights for Ramsay Générale de Santé SA (GDSPA) clients.
- Students and Instructors: Utilize real-world data for practicing and teaching financial modeling techniques.
- Healthcare Sector Enthusiasts: Gain insight into how healthcare companies like Ramsay Générale de Santé SA (GDSPA) are valued in the marketplace.
Contents of the Template
- Pre-Filled Data: Features Ramsay Générale de Santé SA's (GDSPA) historical financial data and projections.
- Discounted Cash Flow Model: A customizable DCF valuation model with automatic calculations.
- Weighted Average Cost of Capital (WACC): A separate sheet for WACC calculation based on personalized inputs.
- Key Financial Ratios: Evaluate Ramsay Générale de Santé SA's (GDSPA) efficiency, profitability, and leverage metrics.
- Customizable Inputs: Easily modify revenue growth, margins, and tax rates.
- Clear Dashboard: Visual presentations including charts and tables that summarize important valuation results.
Disclaimer
All information, articles, and product details provided on this website are for general informational and educational purposes only. We do not claim any ownership over, nor do we intend to infringe upon, any trademarks, copyrights, logos, brand names, or other intellectual property mentioned or depicted on this site. Such intellectual property remains the property of its respective owners, and any references here are made solely for identification or informational purposes, without implying any affiliation, endorsement, or partnership.
We make no representations or warranties, express or implied, regarding the accuracy, completeness, or suitability of any content or products presented. Nothing on this website should be construed as legal, tax, investment, financial, medical, or other professional advice. In addition, no part of this site—including articles or product references—constitutes a solicitation, recommendation, endorsement, advertisement, or offer to buy or sell any securities, franchises, or other financial instruments, particularly in jurisdictions where such activity would be unlawful.
All content is of a general nature and may not address the specific circumstances of any individual or entity. It is not a substitute for professional advice or services. Any actions you take based on the information provided here are strictly at your own risk. You accept full responsibility for any decisions or outcomes arising from your use of this website and agree to release us from any liability in connection with your use of, or reliance upon, the content or products found herein.